The Strategic Importance of Knowing Average Purchase Amounts Globally
Across the globe, from the bustling markets of India to the tech-savvy streets of the United States, the AOV for cryptocurrency transactions varies significantly, reflecting diverse economic landscapes and consumer behaviors.
For instance, did you know that the average cryptocurrency purchase amount in the USA often surpasses that in other regions? To be more precise, our data shows that the volume of crypto transactions in the US is at least 2.6 times more than the country with the second-highest volume.
This isn’t just a number; it’s a window into how different regions interact with digital currencies.
As you integrate a crypto on-ramp into your website or app, understanding these nuances becomes more than just beneficial—it becomes crucial. The AOV isn’t just a figure; it’s a compass guiding your business strategies, pricing models, and market approaches.
Table of contents
- AOV in Crypto Transactions: A Key Business Metric
- Pricing Strategy Insights
- Competitive Advantage in a Global Market
- How Does Payment Method Availability Affect AOV by Region?
- What Does Authorization Rate Do to Effective AOV?
- Conclusion
AOV in Crypto Transactions: A Key Business Metric
The Paybis transaction data paints a vivid picture.
Consider the United States, where the average cryptocurrency purchase amount (AOV) is approximately $318.31. This high AOV, compared to other countries, indicates a robust market with significant investment potential.
However, the competition is likely just as fierce. This makes it risky for new startups to go all-in on the United States.
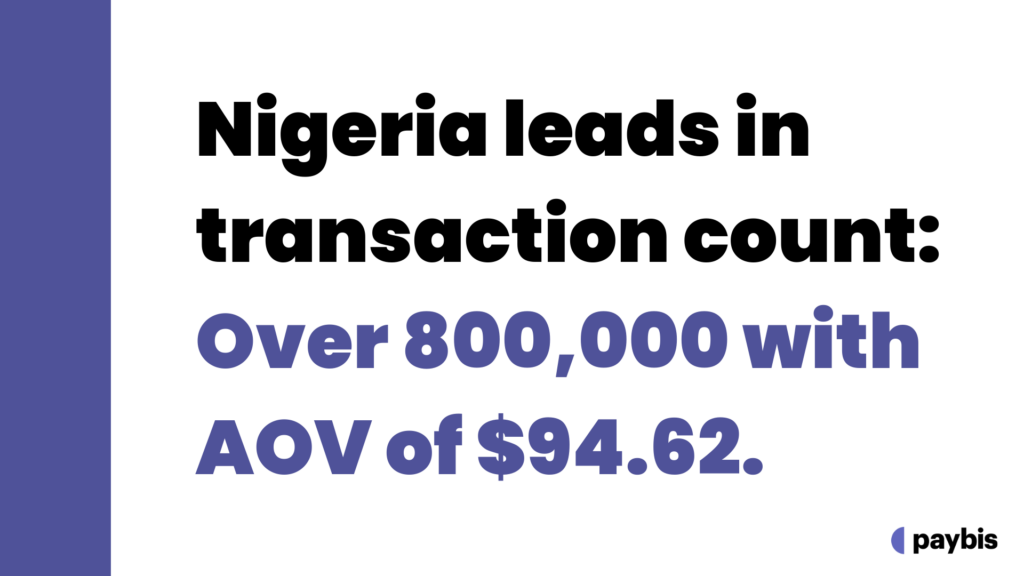
In contrast, take Nigeria, with an AOV of around $94.62 yet leading in transaction count with over 800,000 transactions. This scenario shows a high frequency of transactions with smaller individual values, indicative of different consumer behavior and market dynamics.
Germany presents another interesting case. Despite a lower transaction count of about 62,000, the AOV stands at $344.88 – higher than the USA. This higher AOV, despite fewer transactions, suggests a market with larger, but less frequent, crypto purchases.
These insights are crucial for shaping go-to-market (GTM) strategies, pricing models, and targeting the right audiences. Businesses can tailor their approach based on the unique AOV patterns in each market.
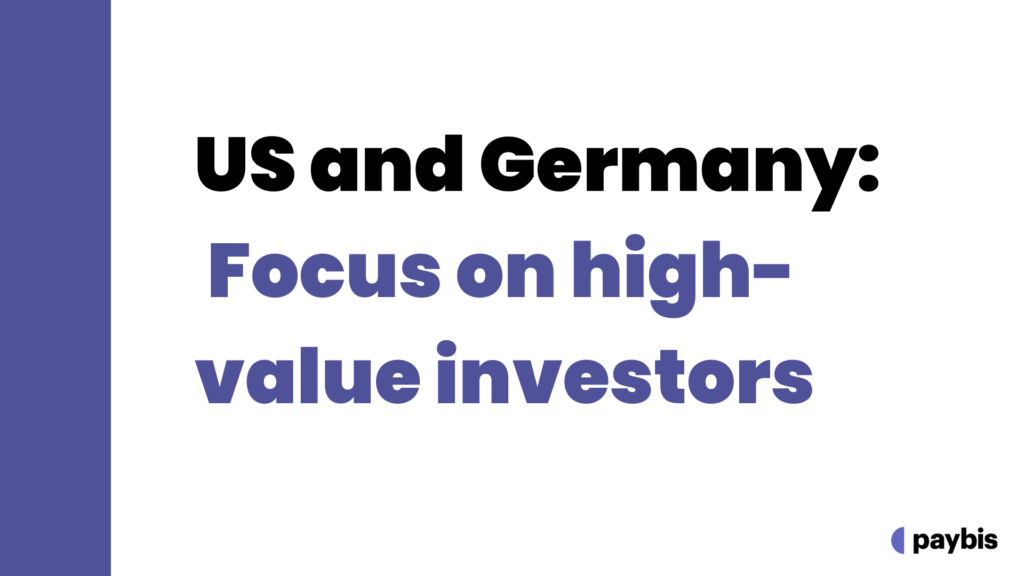
For example, in markets like the US and Germany, where the AOV is higher, strategies might focus on attracting high-value investors. In contrast, in markets like Nigeria, where transaction frequency is higher but the AOV is lower, the focus might shift to accessibility and ease of transaction.
Moreover, AOV can influence marketing channels. In high AOV markets, more personalized, targeted marketing might be effective, while in markets with a lower AOV but higher transaction frequency, broad-reach, high-engagement strategies could be more successful.
Pricing Strategy Insights
Pricing strategy is not just about setting the right numbers; it’s about understanding the market, the customers, and the unique economic environments of different regions.
This is where the average purchase amount becomes a pivotal tool for businesses allowing users to purchase cryptocurrency.
Understanding Regional Differences
High-Volume Markets (e.g., United States)
The United States leads in transaction volume, with an average transaction size of 4 times greater than its neighbor, Canada.
In such a market, a tiered pricing strategy can be effective. For instance, offering lower transaction fees for higher purchase amounts might encourage larger transactions.
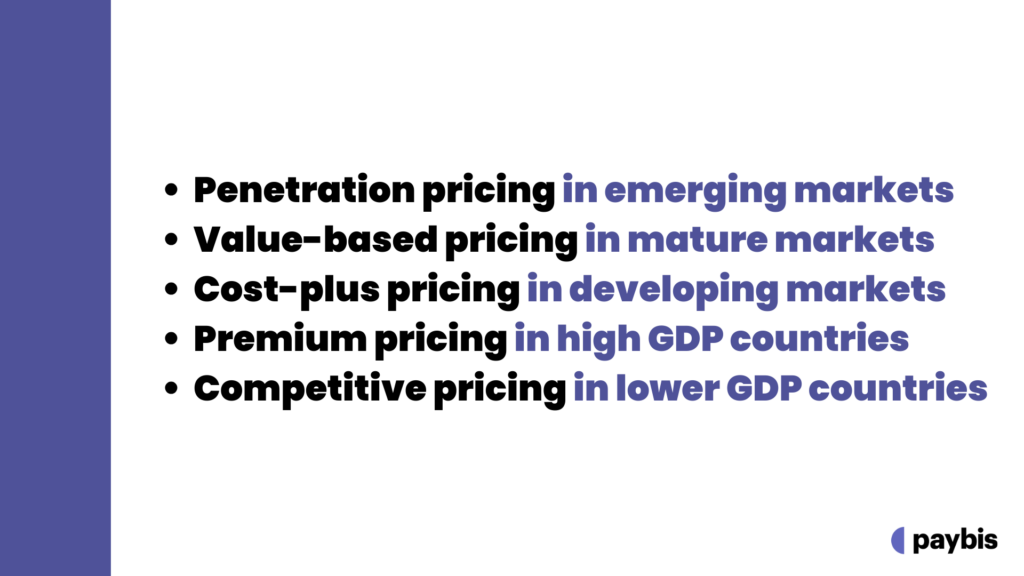
Emerging Markets (e.g., Nigeria, India)
Nigeria and India, with average transaction sizes of $94.62 and $533.61 respectively, represent markets with varying levels of crypto adoption. In these markets, a penetration pricing strategy could be ideal. This involves setting lower prices initially to attract customers and gradually increasing them as the market matures.
Tailoring Strategies to Market Maturity:
Mature Markets (e.g., Germany, Canada)
In mature markets like Germany ($344.89 AOV) and Canada ($84.34 AOV), businesses could adopt a value-based pricing strategy.
This involves pricing services based on the perceived value to the customer, which is high in these technologically advanced and economically stable regions.
Developing Markets (e.g., Bangladesh, South Africa)
For developing markets such as Bangladesh ($444.67 AOV) and South Africa ($339 AOV), cost-plus pricing might be more appropriate.
Here, prices are set by marking up costs by a certain percentage, ensuring affordability in price-sensitive markets.
Adapting to Local Economic Conditions
High GDP per Capita (e.g., Singapore, Norway)
In countries with high GDP per capita like Singapore ($655.62 AOV) and Norway ($269.13 AOV), businesses can implement premium pricing strategies. This involves setting higher prices that reflect the higher economic status of the average consumer.
Lower GDP per Capita (e.g., Ukraine, Vietnam)
Conversely, in countries with lower GDP per capita such as Ukraine ($943.14 AOV) and Vietnam ($1,364.30 AOV), a competitive pricing strategy could be more effective. This means setting prices comparable to or slightly lower than competitors to capture the price-sensitive segment of the market.
Competitive Advantage in a Global Market
Consider this: the US leads in crypto transaction volumes, with an average transaction size of $318.31, a stark contrast to countries like Canada and Nigeria, where the AOVs are $84.34 and $94.62 respectively. This disparity isn’t merely numerical; it reflects varied market maturities, consumer behaviors, and economic conditions.
By understanding these differences, businesses can tailor their services to meet the unique demands of each market, offering personalized experiences that set them apart from competitors.
In high-volume, mature markets like the US, businesses can focus on offering advanced features and premium services, catering to a clientele that is both financially robust and technologically savvy. In contrast, in emerging markets like Nigeria, where the crypto adoption is still in nascent stages, the focus could be on accessibility, ease of use, and educational resources, appealing to a rapidly growing customer base.
Moreover, these AOV insights enable businesses to forecast market trends, anticipate changes in consumer behavior, and adjust their strategies accordingly. This proactive approach not only helps in retaining current customers but also in attracting new ones, thus expanding market share.
How Does Payment Method Availability Affect AOV by Region?
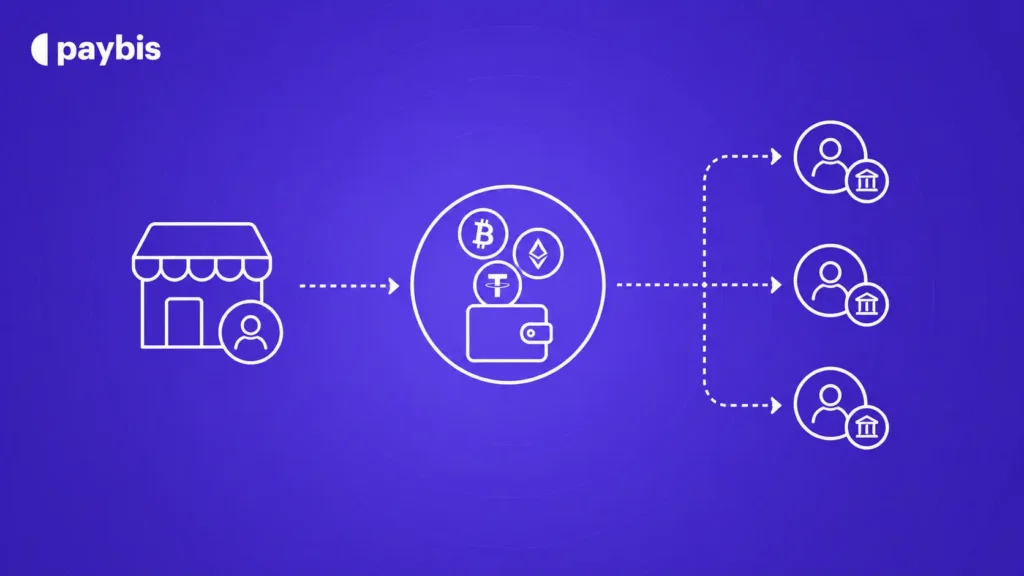
AOV doesn’t exist in isolation from the payment infrastructure available in each market. The two are connected in ways that directly affect integration decisions.
In high-AOV markets like Germany ($344.88) and Singapore ($655.62), bank transfer methods like SEPA dominate for larger purchases. Users in these markets are comfortable initiating a transfer for a meaningful amount. Card purchases still happen but skew toward smaller, more spontaneous buys. An on-ramp that only supports cards in these markets is systematically capping transaction size.
In markets like Nigeria ($94.62 AOV, 800,000+ transactions), the dynamic is different. Mobile money is the primary financial infrastructure for a large segment of the population. High transaction frequency with lower individual values is a direct function of how money moves in that market, not of lower intent. Platforms that support local payment rails like M-Pesa unlock volume that card-only infrastructure simply cannot reach.
Vietnam ($1,364.30 AOV) and Ukraine ($943.14 AOV) show some of the highest AOVs in Paybis data despite lower GDP per capita. This is counter-intuitive until you factor in payment method access. In markets where fewer payment methods work reliably, the users who do transact tend to be more deliberate, making larger purchases when they can rather than smaller frequent ones. The AOV reflects friction in access, not purchasing power alone.
For businesses integrating a crypto on-ramp, this means payment method coverage is not just a feature list. It directly determines which segments of each market you can reach and at what transaction size. The white-label on/off-ramp supports 20+ payment methods including regional options across Africa, Latin America, and Southeast Asia, which is what makes the cross-regional AOV data in this article actionable rather than just descriptive.
What Does Authorization Rate Do to Effective AOV?
There’s a metric that sits between intended AOV and actual revenue that most analysis skips: authorization rate.
A user in Poland initiates a $400 crypto purchase with a Mastercard. Their bank declines it. They try again with a different card. Second decline. They abandon. The intended AOV was $400. The actual revenue was zero.
Authorization rates vary significantly by region, card type, and payment method. In markets where crypto purchases are frequently blocked by issuing banks, the effective AOV that actually converts is lower than the raw transaction data suggests. In markets with higher authorization rates, more of the intended volume lands.
This has a direct implication for GTM strategy. A market with a high AOV but a low authorization rate is not necessarily more valuable than a market with a moderate AOV and strong authorization rates. The product question is not just “what do users want to spend?” but “what payment method combination clears reliably in this market?”
Platforms that use payment orchestration, routing transactions across multiple processors and payment methods based on real-time success rates, recover a meaningful share of would-be declines. The full breakdown of how authorization rates interact with on-ramp revenue is covered in our guide on authorization vs success rates for on-ramps.
Conclusion
AOV is not just a mere statistic; it’s a critical lens through which businesses can view and comprehend the varied and intricate tapestry of global markets.
From the high-volume transactions in the US to the frequent, smaller transactions in Nigeria, each pattern of AOV reveals unique consumer behaviors and economic conditions.
By tapping into these insights, businesses can craft tailored strategies that resonate with each market’s specific needs and opportunities.
Whether it’s adopting a tiered pricing strategy in the US, focusing on accessibility in emerging markets like Nigeria, or leveraging premium pricing in high GDP countries like Singapore, the right approach to AOV can lead to enhanced market penetration, customer satisfaction, and ultimately, a significant competitive edge.
Follow the Paybis blog for deeper insights that can take your business from zero to one in new markets around the world.
FAQ
Why is the average order value so much higher in some developing markets like Vietnam and Ukraine?
High AOV in lower-GDP markets often reflects access friction rather than purchasing power. When reliable payment methods are limited, the users who do complete transactions tend to make larger individual purchases rather than smaller frequent ones. The AOV reflects how people transact when they have a working payment method, not an average of all intended transactions.
Does AOV differ by payment method within the same market?
Yes, significantly. Bank transfer users consistently show higher AOVs than card users in the same market. Users initiating a bank transfer are making a deliberate, planned purchase. Card purchases are more spontaneous and skew toward smaller amounts. For on-ramp operators, supporting both methods in high-AOV markets captures different segments of the same user base.
How should GTM strategy differ between a high-AOV and a high-frequency market?
High-AOV markets reward investment in payment rails that support larger transactions cleanly, such as SEPA or ACH, and in UX that doesn’t create friction for larger amounts. High-frequency markets reward coverage breadth, low minimums, local payment methods, and speed. The two call for different product priorities and different marketing approaches.
Is Paybis AOV data from a specific time period?
The core data in this article is from 2023. Transaction behaviour and market composition shift over time, particularly as crypto adoption expands in emerging markets and as payment infrastructure develops. The regional patterns the data reveals are durable, but specific figures will evolve. Paybis continues to track AOV across its transaction base and incorporates updated data into product and partner strategy.
Disclaimer: Don’t invest unless you’re prepared to lose all the money you invest. This is a high‑risk investment and you should not expect to be protected if something goes wrong. Take 2 mins to learn more at: https://go.payb.is/FCA-Info