On-Ramp Fee Transparency: How to Calculate Net Received and Identify Hidden Spreads
Key Takeaways:Net received (the actual crypto delivered to a user’s wallet) is the only accurate metric for comparing on-ramp providers. Advertised fee percentages are a marketing metric, not a cost metric. Most providers embed their margin inside the quoted exchange rate. A provider advertising “0.5% fees” can extract additional costs from a transaction through spread alone, and the cost never appears on the checkout screen. To calculate the hidden spread: Spread % = ((Quoted Rate – Market Rate) / Market Rate) * 100. Use CoinGecko or CoinMarketCap for the real market rate, and CME CF Benchmarks for regulated reference rates. Paybis offers B2B partners a 0.49% base rate with end-user fees starting from 1.49%, displayed as separate line items (Service Fee, Processing Fee, Network Fee) before the user confirms. No spread is embedded in the exchange rate.
The cheapest crypto on-ramp is rarely the one advertising the lowest percentage fee. Some product leaders at crypto-native platforms integrate an on-ramp partner based on an advertised 0.5% fee, only to discover their users receive less crypto than expected. The margin doesn’t disappear in the fee line. It hides in the exchange rate spread: a silent markup embedded in the quoted token price that never appears on a fee schedule.
This guide gives you the exact mathematical formulas to expose hidden spreads, calculate true net received, and evaluate on-ramp providers on an apples-to-apples basis.
Table of contents
- The Problem With Advertised Crypto On-Ramp Fees
- What Is Net Received?
- How to Calculate On-Ramp Spread and Hidden Markups
- Step-by-Step Guide to Calculating True Net Received
- A Fair Fee Comparison Framework for Crypto Platforms
- Net Received vs. Advertised Fees: Real-World Examples
- How Network Fees and Volatility Impact Final Settlement
- How Paybis Delivers Fee Transparency for Crypto Platforms
- Key Terminology
The Problem With Advertised Crypto On-Ramp Fees
When a provider publishes “fees from 0.5%,” that number describes one component of the total cost, not the total cost itself. The exchange rate is where the real margin lives. As crypto exchange economics research shows, exchanges profit from more than just fee lines every single day, and the mechanism is almost always the spread.
Here’s how it works in practice. In a typical scenario, Bitcoin’s market rate at a given moment might be $74,000 (verifiable on CoinGecko or CoinMarketCap). A provider could quote $77,100. The fee schedule says 0.5%. What you never see itemized is the $3,100 price difference (a 4.2% markup) built into the rate before the explicit fee is even applied. A user buying $1,000 of Bitcoin receives $1,000 / $77,100 = 0.012970 BTC instead of $1,000 / $74,000 = 0.013514 BTC at the true market rate. That is approximately a 4.2% shortfall they never consented to, because it was never disclosed as a fee.
For platforms relying on conversion rates to drive TVL growth and user retention, this matters directly. When users receive consistently less crypto than the quoted amount implies, trust erodes, support queues fill with “where is my crypto?” tickets, and community threads flag the platform as unreliable. As one G2 reviewer noted:
“I especially appreciate the transparent fee structure – no hidden costs or surprises.” – Vladimir Z. on G2
The issue is that not every provider makes that kind of transparency the default.
What Is Net Received?
Net received is the amount of cryptocurrency that lands in a user’s wallet after every deduction has been made. It is the only metric that allows you to compare two on-ramp providers fairly, because it captures all visible and invisible costs in one number.
The universal formula:
Net Received = ((Fiat Input - Service Fee - Processing Fee) / Effective Exchange Rate) - Network Fee
When the spread is a separate variable:
Net Received = (Fiat Input / (Market Rate + Spread)) - Explicit Fees - Network Fee
The challenge is that most providers bundle the spread into the effective exchange rate rather than separating it as a distinct line item. This is why two providers with identical advertised fee percentages produce materially different net received amounts on an identical $1,000 transaction. Our dynamic price documentation explains how real-time pricing works in practice, and the cryptocurrency price terms and conditions clarify exactly what users see before confirming.
How to Calculate On-Ramp Spread and Hidden Markups
The spread is the price difference between the real-time market rate and the rate quoted by the provider. As the Corporate Finance Institute explains, the spread percentage in forex uses bid and ask prices: Spread % = ((Ask Price – Bid Price) / Ask Price) * 100. For crypto on-ramps, the same principle applies, with the “ask price” being the rate quoted by the provider.
Formula: Spread Amount
Spread Amount = (Quoted Rate - Market Rate) * Crypto Amount
Formula: Spread Percentage
Spread % = ((Quoted Rate - Market Rate) / Market Rate) * 100
Where to source the true market rate:
- CoinGecko: Real-time aggregated prices across thousands of exchanges
- CoinMarketCap: Industry-standard reference with rigorous data methodology
- CME CF Cryptocurrency Benchmarks: Regulated reference rates aligned to the European Benchmarks Regulation, sourced from Bitstamp, Coinbase, Gemini, itBit, Kraken, LMAX Digital, Bullish, and Crypto.com. The most defensible benchmark for enterprise-level margin calculations.
Comparing the provider’s quoted rate against the CME CF or CoinGecko rate can help identify potential margin extraction beyond stated service costs.
Step-by-Step Guide to Calculating True Net Received
Use this process for any provider, any asset, any transaction size.
Scenario: $1,000 USDC purchase via credit card
Market rate (from CoinGecko): 1 USDC = $1.001 (example mid-market rate)
Provider quoted rate: 1 USDC = $1.043 (hypothetical Provider A, opaque model)
- Identify the explicit fees. Check the provider’s published fee schedule for Service Fee and the Processing Fee. For Provider A: 0.5% service fee + 4.5% processing fee = $50.00 in explicit fees.
- Calculate net fiat after explicit fees. $1,000 – $50.00 = $950.00 available for the crypto purchase.
- Apply the quoted rate. $950 / $1.043 = 910.83 USDC delivered before network fee.
- Calculate what the user should have received at market rate. $950 / $1.001 = 949.05 USDC at the true market rate.
- Calculate the spread loss. 949.05 – 910.83 = 38.22 USDC lost to spread. That is $38.22 never disclosed as a fee.
- Subtract the network fee. Bitcoin fees currently average between $0.30 and $0.82 per transaction, according to current bitcoin transaction fee data. For USDC on Ethereum, fees vary significantly with congestion. Use Etherscan for exact figures on your target chain.
- Arrive at true net received. 910.83 USDC – network fee.
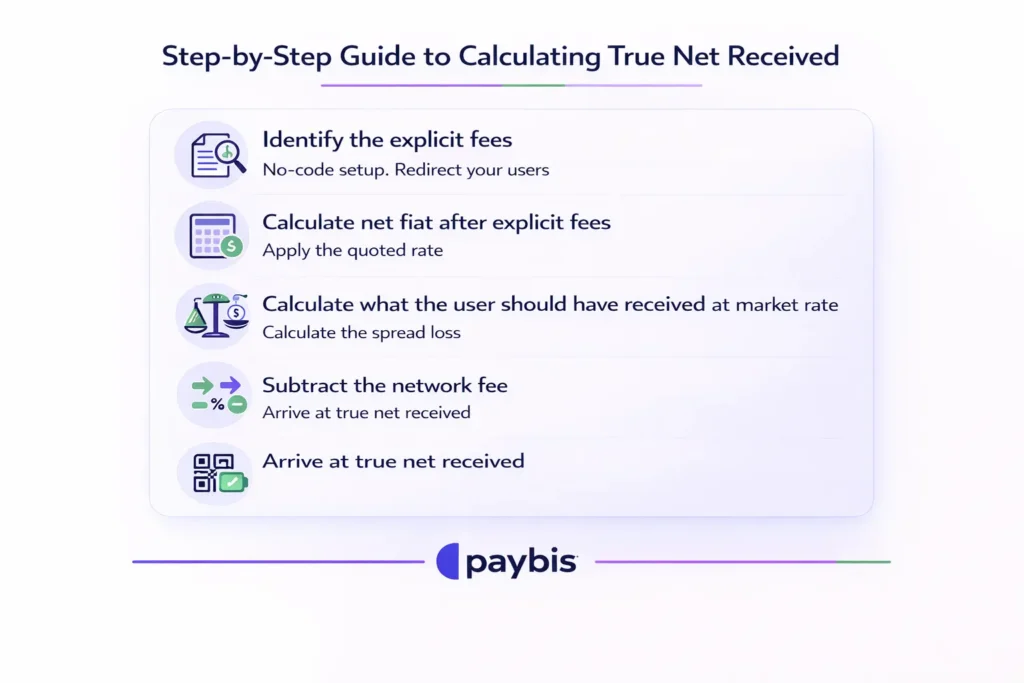
The flowchart below shows the lifecycle of a $1,000 fiat deposit and where each fee is deducted.
The Paybis Crypto Calculator tutorial demonstrates how this calculation is displayed in real time before a user confirms any transaction, which is the standard to benchmark other providers against.
A Fair Fee Comparison Framework for Crypto Platforms
Evaluating on-ramp providers requires a structured methodology, not a quick scan of a pricing page. Here’s the framework to run before any integration decision.
Step 1: Decompose total cost into four components.
| Cost Component | What It Is | Controlled By |
|---|---|---|
| Service Fee | Platform margin per transaction | Provider |
| Processing Fee | Card network / acquirer cost | Provider (passed through) |
| Spread | Exchange rate markup above market rate | Provider |
| Network Fee | Blockchain confirmation cost | Miners / validators |
Step 2: Test the exchange rate independently. Request a live quote from the provider API at multiple transaction amounts. Simultaneously record the CoinGecko or CME CF rate. Apply the spread formula. Any provider unwilling to let you verify this programmatically should be questioned closely about where margin is embedded.
Step 3: Evaluate API integration flexibility alongside pricing. A provider with transparent pricing but a lengthy integration timeline or no sandbox environment introduces a different kind of cost: engineering sprint delays. Verify integration options (URL redirect vs. hosted widget vs. native SDK) before pricing negotiations start.
Step 4: Run a bulk transaction simulation. Model a representative sample of transactions at your typical transaction size distribution. Total spread loss across that volume reveals the real annual infrastructure cost differential between providers.
Step 5: Factor in compliance overhead. Providers registered with FinCEN and FINTRAC with PCI DSS Level 1 compliance have absorbed significant licensing work. If you’re expanding into 10+ markets, that operational cost surfaces either in explicit fees or in hidden spread. Verify registration numbers before integration.
Net Received vs. Advertised Fees: Real-World Examples
The table below contrasts two provider models across three transaction sizes. “Provider A” represents a low-advertised-fee model with spread embedded in the exchange rate. “Provider B (Transparent)” represents an itemized fee model with no spread markup on the quoted rate.
Hypothetical Scenario Assumptions: Provider A model: 0.5% service fee + 4.5% processing fee + 3.5% embedded spread. Provider B model: 1.49% service fee + 4.5% processing fee + 0% spread.
| Transaction Size | Provider A Total Cost | Provider B Total Cost | Provider A Net Received | Provider B Net Received |
|---|---|---|---|---|
| $100 | $8.50 (5% + 3.5% spread) | $5.99 (5.99%) | ~$91.50 | ~$94.01 |
| $1,000 | $85.00 (5% + 3.5% spread) | $59.90 (5.99%) | ~$915.00 | ~$940.10 |
| $5,000 | $425.00 (5% + 3.5% spread) | $299.50 (5.99%) | ~$4,575.00 | ~$4,700.50 |
At $5,000, the “cheaper” provider extracts $425.00 vs. $299.50, despite advertising a lower headline fee. The user receives $4,575.00 worth of crypto instead of $4,700.50. That $125.50 gap per transaction, multiplied across thousands of monthly users, represents measurable TVL reduction and compounding trust damage.
How Network Fees and Volatility Impact Final Settlement
Network fees (the cost blockchain miners charge to confirm a transaction) are not controlled by any on-ramp provider. They fluctuate with blockchain demand and can materially affect the final net received amount, particularly on Ethereum during peak congestion.
Current benchmarks (as of March 2026):
- Bitcoin: Average transaction fee sits between $0.30 and $0.82, based on current bitcoin transaction fee data. Under congestion, fees can spike to $5 or higher.
- Ethereum: Standard transfers range from under $1 in low-traffic periods to $50+ during peak events, as covered in Paybis’s Bitcoin Lightning Network infrastructure guide.
- Alternative chains: Polygon transfers remain under $0.01, making them materially cheaper for high-frequency, low-value transactions.
Quote-lock periods can introduce volatility risk in some scenarios. We process most transactions within 10 to 20 minutes, with subsequent purchases using the same card completing in around 30 seconds, and settlement timing depends on the blockchain. Paybis locks the quoted price for 15 minutes during checkout and displays the final crypto amount before payment is confirmed, removing settlement-time exchange rate risk for standard card transactions.
How Paybis Delivers Fee Transparency for Crypto Platforms
We operate as a direct fiat on-ramp in 180+ countries, supporting 20+ payment methods and 90+ cryptocurrencies. Our fee model separates every cost component before the user clicks confirm. End-user fees start from 1.49% after the first transaction (which carries a 0% service fee). No spread is embedded in the quoted exchange rate. The total cost shown at checkout is the total cost charged.
Our transparent checkout shows end users:
- Service Fee: We charge 1.49% after your first transaction (which carries 0% service fee), displayed as a specific dollar amount
- Processing Fee: 4.5% for card transactions over $50 in USD, EUR, GBP, or JPY (up to 6.5% for other currencies)
- Network Fee: Displayed as a live estimate, clearly labeled as variable and set by blockchain miners
- Total crypto received: Calculated in real time before payment confirmation
We’ve reportedly processed $1.2B+ in annual transaction volume across 5M+ retail users and corporate clients. The platform has operated without a security breach since 2014 and holds 30,780+ Trustpilot reviews with a rating of 4.1 or “Great.” As one reviewer who specifically evaluated fee disclosure noted:
“Fees and exchange rates are displayed transparently before confirmation, making it easy to understand exactly what you…” – Joon Huh on Trustpilot
The full fee structure and credit and debit card buying documentation are publicly available without a gated demo request, including Apple Pay support documentation and the corporate SEPA buying guide for institutional flows.
Approval rates under card BIN variability can be maintained through cascade routing (automatically distributing transactions across multiple acquirers with fallback if one declines). The mechanics of cascading payment systems mean each transaction gets multiple approval opportunities, reducing the card failure rate that drives user abandonment at the payment step.
Ready to evaluate our B2B model against your current provider? Review the Paybis API documentation or contact our sales team to run a net-received comparison against your existing on-ramp.
Key Terminology
Spread: The difference between the rate a provider quotes for a crypto purchase and the real mid-market rate from a neutral aggregator like CoinGecko or CME CF Benchmarks. Spread is expressed as a percentage of the market rate and is the primary mechanism through which providers embed hidden margin in on-ramp transactions.
FX Markup: An additional charge applied to the exchange rate when converting between two fiat currencies (e.g., EUR to USD) before the crypto purchase, as explained in Skydo’s forex markup overview. This fee appears on top of the base exchange rate and is separate from the spread on the crypto asset itself, typically running 1-3% for non-primary currency pairs.
Network Fee: The cost charged by blockchain miners or validators to confirm a transaction on-chain, not controlled by any on-ramp provider. Bitcoin network fees currently average $0.30-$0.82 but can spike to $5+ during peak demand, per current bitcoin fee data.
Cascade Routing: A payment processing method that distributes a transaction across multiple payment service providers in sequence. If the first acquirer declines the card, the transaction automatically routes to the next acquirer, increasing overall approval rates and reducing session abandonment from card declines, as detailed in GoCardless’s cascading payments guide.
Net Received: The actual amount of cryptocurrency delivered to a user’s wallet after all deductions (Service Fee, Processing Fee, Spread, Network Fee). This is the only metric that allows accurate, apples-to-apples comparison between on-ramp providers and the starting point for any B2B revenue share modeling.
FAQ
What is the average crypto on-ramp spread in 2026?
Spreads vary by provider and asset pair. While specific industry-wide data is limited, providers commonly embed spreads above the mid-market rate. The spread formula (Spread % = ((Quoted Rate – Market Rate) / Market Rate) * 100) lets you measure any provider’s markup directly via their quote API.
How do FX markups affect international users?
An FX markup adds 1-3% in cost when a user pays in one currency but the provider prices the transaction in another (e.g., EUR to USD), as detailed in Skydo’s forex markup explainer. This charge is entirely separate from the spread on the crypto asset itself.
How do I verify a provider's exchange rate before integrating?
Call the provider’s quote endpoint via API and record the rate in real time, then simultaneously pull the mid-market rate from CoinGecko or CME CF Benchmarks. Apply the spread formula. Any result above 0.5% may indicate embedded margin worth evaluating as you model your integration costs and revenue structure.
Does faster settlement time reduce slippage risk?
Yes. The longer the gap between a user’s quote lock and the actual on-chain settlement confirmation, the greater the potential variance between the quoted crypto amount and the settled amount. Providers with instant processing (<1 minute) and near-to-instant settlement reduce this exposure significantly.
Disclaimer: Don’t invest unless you’re prepared to lose all the money you invest. This is a high‑risk investment and you should not expect to be protected if something goes wrong. Take 2 mins to learn more at: https://go.payb.is/FCA-Info