Bitcoin Dominance
Bitcoin dominance shows how much investor interest is focused on Bitcoin compared to other cryptocurrencies. High dominance suggests stronger confidence in Bitcoin, while lower dominance indicates growing interest in altcoins.
Bitcoin dominance measures Bitcoin’s share of the total cryptocurrency market. It shows how strong Bitcoin is compared to all other cryptocurrencies combined. A rising dominance often means investors prefer Bitcoin, while a falling dominance suggests money is moving into altcoins. This metric is widely used to understand market trends and investor sentiment.
Table of contents
- What is Bitcoin Dominance?
- Origin of Bitcoin Dominance
- Understanding the Bitcoin Dominance Chart
- Bitcoin Market Dominance vs Bitcoin Dominance Index
- BTC Dominance vs Other Technical Analysis Metrics
- Tips on Trading Using BTC Dominance
- What Current Bitcoin Dominance Tells You Today
- Where to Track BTC Dominance?
What is Bitcoin Dominance?
Bitcoin dominance refers to the measure of Bitcoin’s value in comparison to the total market capitalization of all other cryptocurrencies combined. It’s a commonly used metric in the cryptocurrency market to gauge Bitcoin’s market share relative to the entire crypto market.
Here’s how it works:
- Market Capitalization: This is the total value of a cryptocurrency, calculated by multiplying its current price by the total number of coins in circulation. For Bitcoin, this would be the price of one Bitcoin multiplied by the total number of Bitcoins in existence.
- Total Cryptocurrency Market Cap: This is the sum of the market capitalizations of all cryptocurrencies in the market, including Bitcoin.
- Bitcoin Dominance Percentage: This is calculated by dividing Bitcoin’s market capitalization by the total market cap of all cryptocurrencies and then multiplying by 100 to get a percentage.
Bitcoin Dominance=(Bitcoin Market Cap/Total Crypto Market Cap) x 100
This metric is closely watched by crypto investors and analysts as it can reflect shifts in the sentiment and trends within the cryptocurrency market.
Origin of Bitcoin Dominance
When Bitcoin first appeared, it was the only cryptocurrency, so it had 100% market share. Later, other cryptocurrencies like Litecoin, Ethereum, and Ripple were created, and Bitcoin’s share began to change. To track Bitcoin’s position, the Bitcoin dominance metric was introduced. It shows how large Bitcoin’s market value is compared to the total crypto market.
Bitcoin also became the market leader. When Bitcoin’s price drops, the whole market often drops. When it rises, other coins usually rise too. This led to the idea of the crypto money flow cycle, where money often moves from Bitcoin to other cryptocurrencies during market cycles.
Understanding the Bitcoin Dominance Chart
Bitcoin dominance charts are a crucial tool for understanding the relative strength of Bitcoin in the cryptocurrency market. For beginners, these charts might seem daunting, but with a bit of guidance, they can be a valuable resource.
Reading and Interpreting BTC Dominance Chart
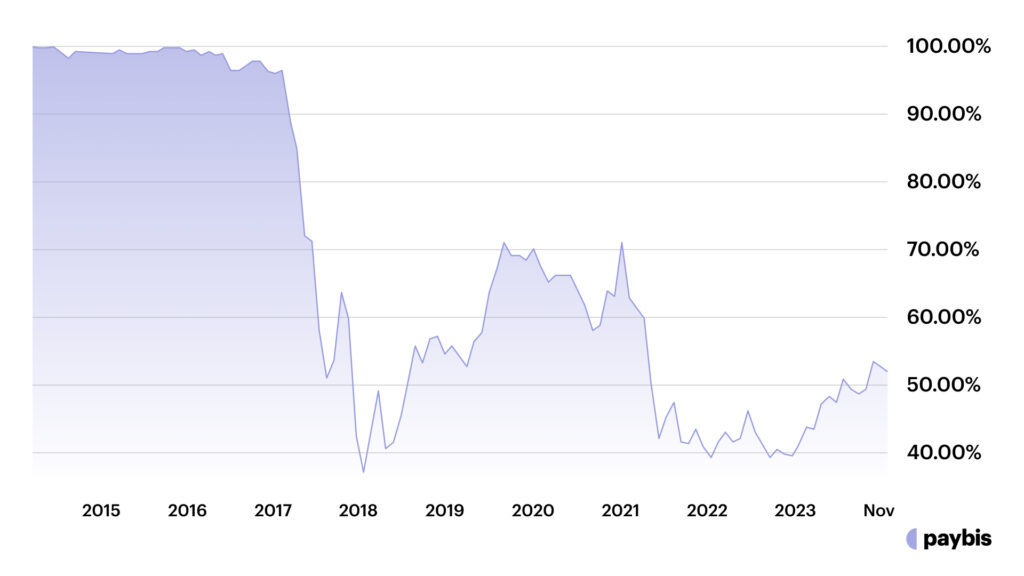
You’ll typically see a line graph with time on the horizontal axis (X-axis) and the percentage of Bitcoin dominance on the vertical axis (Y-axis). This chart is unique as it does not reflect prices but market share.
- Time (X-Axis): The time scale can greatly affect the chart’s interpretation. A shorter time frame, like days or weeks, can show quick fluctuations, highlighting short-term trends or reactions to specific events. In contrast, a longer time frame, like months or years, provides a broader view, showing long-term trends and shifts in investor sentiment.
- Percentage of Dominance (Y-Axis): This scale is the heart of the chart. The percentage indicates how much of the total cryptocurrency market capitalization is made up of Bitcoin. It’s crucial to understand that a small change in percentage can represent a significant shift in capital.
The steepness and duration of a trend can tell you about the market’s momentum. A sharp increase in Bitcoin dominance might indicate a sudden shift in investor sentiment, possibly due to a major event. Conversely, a gradual trend could suggest a slow but steady change in long-term investor preferences.
How to Read Bitcoin Dominance Percentage
Here’s what different ranges mean:
- 70%+ dominance: Bitcoin is king, and money flows to safety. Altcoins struggle to gain momentum. This happens during market uncertainty when investors trust Bitcoin more than alternatives.
- 50-65% dominance: Balanced market. Bitcoin maintains leadership, but altcoins have room to move. Most “normal” market conditions fall here. Money splits between Bitcoin and quality altcoins.
- 40-50% dominance: Altcoin strength building. Capital is rotating from Bitcoin into alternative cryptocurrencies. Watch for a potential altcoin season if this trend continues.
- Below 40% dominance: Peak altcoin mania, which is usually unsustainable. The 2018 crash came after dominance hit 37%. Too much speculation in low-quality projects.
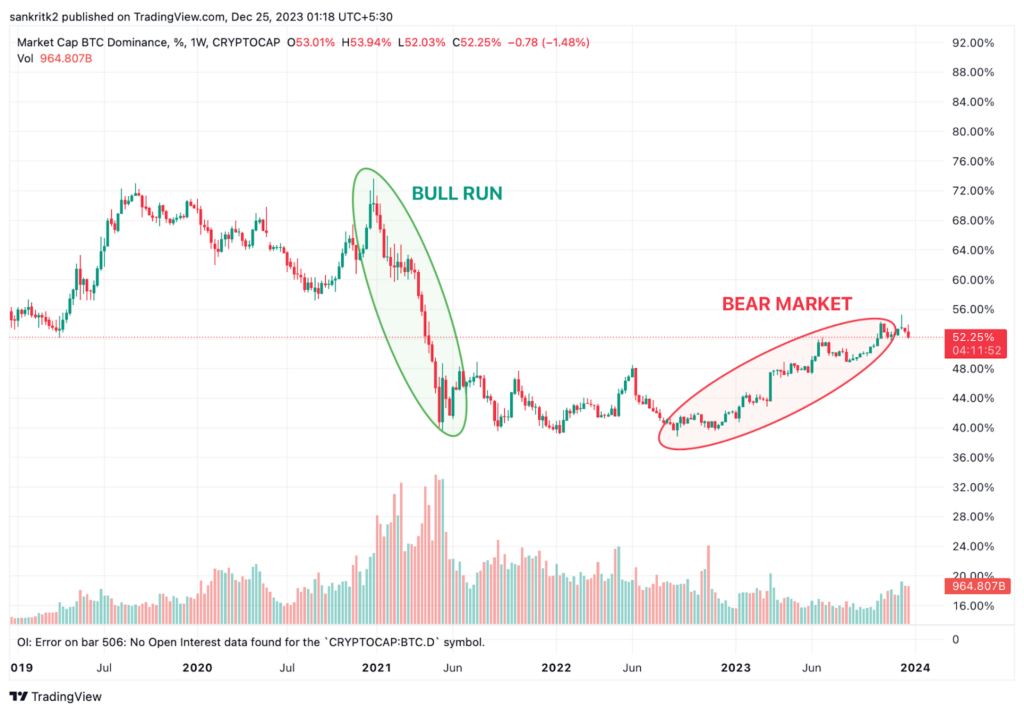
Real example: In May 2021, Bitcoin dominance sat at 45%. By July 2021, it climbed to 58% as the market crashed. Investors fled to Bitcoin’s relative safety while altcoins lost 60-80% of value.
Check current dominance on CoinMarketCap or TradingView. The number updates constantly. Don’t obsess over daily moves. Weekly trends matter more.
Bitcoin Market Dominance vs Bitcoin Dominance Index
Bitcoin market dominance and Bitcoin dominance index mean essentially the same thing, but they appear in different contexts.
- Bitcoin market dominance is the standard term. It’s the percentage calculation everyone references. When someone says “Bitcoin dominance is 58%,” they mean market dominance.
- Bitcoin dominance index usually refers to trading products. On platforms like TradingView, you’ll see ticker symbol BTC.D. This is the Bitcoin dominance index – a tradable asset that tracks the dominance percentage.
Some exchanges let you trade dominance directly. You’re not buying Bitcoin or altcoins. You’re betting on whether Bitcoin’s market share will rise or fall. If you think altcoin season is coming, you can short the dominance index.
The calculation stays identical. Market cap of Bitcoin ÷ Total crypto market cap × 100. The only difference is whether you’re viewing it as a metric or trading it as an index product.
Most investors just watch the number. Active traders might use dominance index futures or perpetual contracts to hedge their altcoin positions.
BTC Dominance vs Other Technical Analysis Metrics
Bitcoin dominance differs from other technical analysis metrics primarily in its focus and method of calculation. It’s a market-wide metric rather than a price-specific metric, and this distinction sets it apart from most other tools in technical analysis.
- Market share, not price: Bitcoin dominance tracks Bitcoin’s share of the total crypto market, not its price movements.
- Market-cap based: It’s calculated using market capitalization, not price or volume indicators like RSI or moving averages.
- Shows market sentiment: High dominance suggests stronger investor preference for Bitcoin over altcoins.
- No trading signals: It doesn’t give technical signals such as overbought/oversold levels or trend reversals.
Tips on Trading Using BTC Dominance
Trading cryptocurrencies (both BTC and altcoins) using Bitcoin dominance as a signal or metric can be an effective strategy, especially for those who understand the broader market dynamics.
When Dominance is Rising
- Conservative Approach: Increase your portfolio’s allocation to Bitcoin. As dominance rises, Bitcoin is generally considered a safer bet compared to altcoins.
- Profit-Taking from Altcoins: Consider taking profits from altcoins if you have them in your portfolio, as they might lose value relative to Bitcoin.
When Dominance is Falling
- Opportunity in Altcoins: Shift a portion of your investment to altcoins. A decreasing dominance often indicates that altcoins might outperform Bitcoin in the short term.
- Selecting Altcoins: Choose altcoins based on solid fundamentals, recent developments, and growth potential. Be cautious with very new or speculative tokens.
What Current Bitcoin Dominance Tells You Today
Bitcoin dominance changes every minute as prices fluctuate across thousands of cryptocurrencies. Checking current dominance shows you the market temperature right now.
Today’s reading means nothing without context. A 58% dominance level carries different implications depending on recent trends.
- If dominance rose from 52% to 58% over two weeks: The market is rotating into Bitcoin. Altcoins are bleeding relative to BTC. This might signal fear, profit-taking from altcoins, or the start of a Bitcoin-focused rally.
- If dominance has been sitting at 58% for three months: Stable market conditions. Neither Bitcoin nor altcoins have momentum, so the market is waiting for a catalyst.
- If dominance fell from 65% to 58% over a month: Altcoins are gaining strength. Money is flowing out of Bitcoin into alternatives. Could be early signs of altcoin season.
Track current dominance on CoinMarketCap, CoinGecko, or TradingView. Update your view weekly, not hourly. Daily fluctuations are noise. Weekly trends signal real money movement.
Compare current levels to historical ranges. Bitcoin dominance hit 37% in 2018 during peak altcoin mania and 70% in 2020 during COVID crash. Today’s reading makes sense within that historical context.
Don’t trade purely on dominance. Use it as one signal among many. Check Bitcoin price trend, altcoin volume, and broader market sentiment before making portfolio decisions.
Where to Track BTC Dominance?
FAQ
What happens when Bitcoin dominance rises?
When Bitcoin dominance rises, it generally means that Bitcoin is outperforming altcoins. Investors may be seeking the relative safety of Bitcoin compared to other cryptocurrencies.
What happens when Bitcoin dominance decreases?
A decrease in Bitcoin dominance suggests that altcoins are gaining market share relative to Bitcoin. This could mean that investors are more willing to take risks on lesser-known assets for potentially higher returns.
Is BTC dominance a reliable metric for trading?
BTC dominance can be a useful metric for traders as it reflects the market’s sentiment towards Bitcoin versus altcoins. However, it should not be the sole basis for trading decisions; it’s best used in conjunction with other analyses.
What is the correlation between Bitcoin dominance and altcoin season?
Bitcoin dominance and altcoin season typically have an inverse relationship. When Bitcoin dominance falls, it often signals the start of an altcoin season, where altcoins gain market share and possibly increase in value.
What factors can affect Bitcoin dominance?
Factors that can affect Bitcoin dominance include:
- Market sentiment and investor confidence
- Regulatory news or changes
- Technological advancements within the crypto space
- Bitcoin’s performance relative to key altcoins
- Broader economic factors influencing risk appetite
How does Bitcoin dominance work?
Bitcoin dominance works by showing Bitcoin’s market cap as a percentage of the total market cap of all cryptocurrencies. It helps gauge whether the market is favoring Bitcoin over altcoins at any given time.
What is the current Bitcoin dominance?
The live BTC dominance data can be found using the tools mentioned in the article. Historically, Bitcoin dominance has been on a decline as more altcoins are emerging with unique propositions.
How do you calculate Bitcoin dominance percentage?
Bitcoin dominance percentage = (Bitcoin market cap ÷ Total crypto market cap) × 100. Example: Bitcoin at $1.2 trillion market cap, total crypto market at $2 trillion, equals 60% dominance. The calculation updates constantly as prices change. You don’t need to calculate it manually – every major crypto data site displays the current dominance percentage.
Is Bitcoin dominance rising or falling right now?
Bitcoin dominance fluctuates constantly. Check real-time data on CoinMarketCap, CoinGecko, or TradingView to see current levels. As of early 2026, dominance typically ranges between 55-65%. Whether it’s rising or falling depends on the timeframe you’re viewing – daily moves can be volatile, but weekly and monthly trends show clearer direction. Compare today’s level to the 30-day average to determine the trend.
What is a bearish signal for Bitcoin dominance?
A bearish signal for Bitcoin dominance means dominance is likely to fall, indicating money flowing from Bitcoin into altcoins. Sharp drops in dominance (5%+ in 2 weeks), breakdowns below key support levels (like 50% dominance), or persistent downtrends over months are bearish signals. This is actually bullish for altcoins but bearish for Bitcoin’s market leadership. In 2017-2018, the dominance falling from 85% to 37% was an extreme bearish signal that ended in market collapse.
Disclaimer: Don’t invest unless you’re prepared to lose all the money you invest. This is a high‑risk investment and you should not expect to be protected if something goes wrong. Take 2 mins to learn more at: https://go.payb.is/FCA-Info