The 12-Point Checklist for Trading Low-Liquidity Crypto (And Avoiding Exit Traps)
Key Takeaways:
Low-liquidity tokens can deliver outsized returns, but execution costs and exit risk destroy most gains before you cash out. Trading volume under $100,000 daily, spreads above 2%, and concentrated holder distribution are red flags that turn paper profits into realized losses. This checklist gives you 12 forensic criteria to score liquidity health, identify bot manipulation, and size positions so slippage doesn’t eat your trade. When you spot a setup, speed matters: Paybis lets you buy ETH (and over 100 more cryptocurrencies) instantly with a card, deploy to your DEX wallet in minutes, and preserve exit optionality when your primary exchange is slow or blocked.
Low-liquidity traps can catch even the most experienced traders out. Getting in is easy. Getting out at the price you see is where capital dies.
Most guides tell you to “check the team” or “read the whitepaper.” I am going to show you how to audit the market structure itself: order book depth, bot activity, holder concentration, and the actual cost of execution. Then I’ll show you how to deploy capital fast when you find a valid setup, because in illiquid markets, the difference between a good entry and chasing a 20% pump is often 30 minutes of banking friction.
Table of contents
The Mechanics of The Trap: Why Low Liquidity Kills Gains
Liquidity is not about how much you believe in a project. It is about whether the market can absorb your order without moving the price against you.
Here is what “low liquidity” actually means in quantifiable terms:
Daily volume below $100,000 and volume-to-market cap ratio under 2%: At $50,000 daily volume, a single $10,000 order moves the market 5-10%. Bitcoin trades over $40 billion daily. Healthy tokens trade between 2% and 10% of their market cap daily. Below 1%, your order becomes the market.
Order book depth under $20,000 within ±2% of current price: If the order book shows only $15,000 in bids and asks within a 2% price range, your $10,000 market order will blow through price levels and execute at a far worse average than you expected.
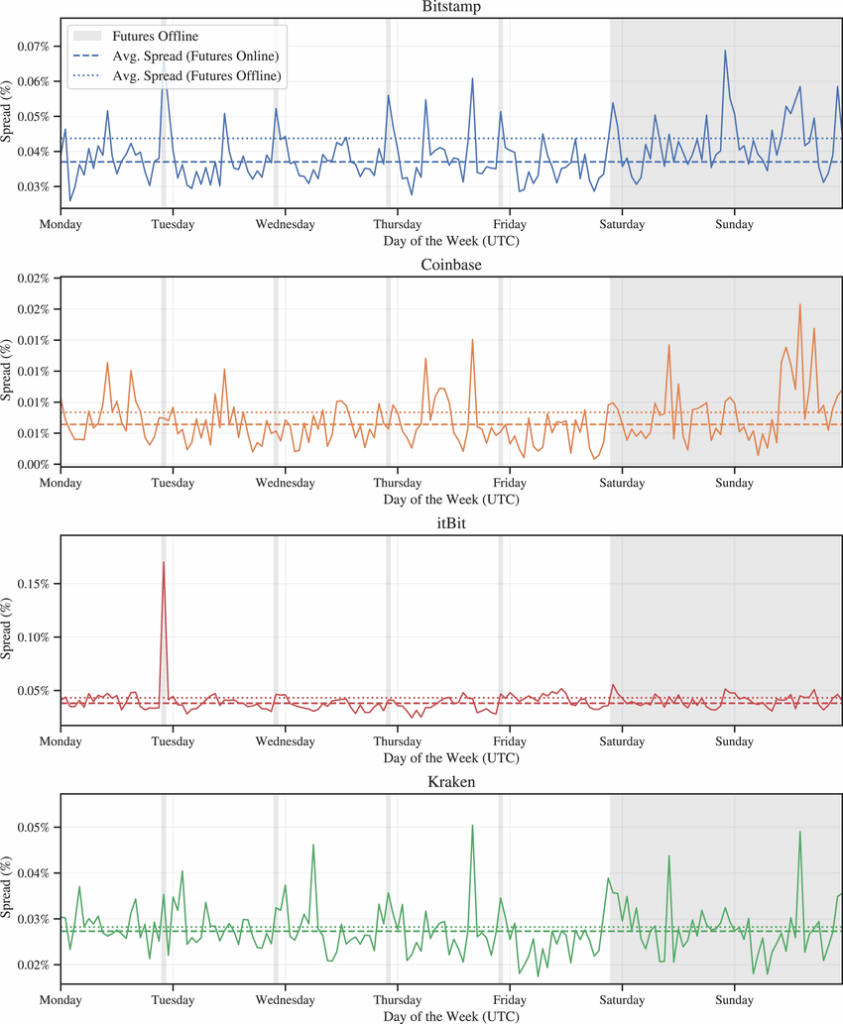
Bid-ask spread over 1-2%: The spread is the gap between the highest buy price and the lowest sell price. On liquid assets like BTC, the spread is typically 0.01-0.05% according to academic research on exchange spreads. On illiquid tokens, spreads of 1-2% are common, and spreads of 5%+ exist on the worst pairs. You pay this cost twice: once when you buy, once when you sell.
Slippage beyond 0.5% on a $10,000 order: Slippage is the difference between the price you expected and the price you got. For traders, slippage over 0.5% on a $10,000 order should trigger caution. On decentralized exchanges using automated market makers (AMMs), slippage scales non-linearly. A trade representing 1% of a liquidity pool causes roughly 2% slippage. A trade that is 10% of the pool can cause 25%+ slippage due to the constant product formula used in AMM protocols.
Here’s the math on a $1,000 buy order with 2% spread and 3% slippage:
You intend to buy at $1.00 per token. The ask price is $1.02 (2% spread). Your order experiences 3% slippage due to low liquidity, so your effective entry price is $1.02 × 1.03 = $1.0506. You receive 951.84 tokens instead of 1,000. To break even, the token must appreciate enough to cover both entry and exit costs. Assuming similar friction on the way out (another 5% total), the token needs to gain roughly 10% just for you to get your $1,000 back.
Now scale that to a $10,000 position targeting 20% net profit. With 7% entry friction and 7% exit friction, the token must rise 39% gross for you to net 20%. That is the low-liquidity tax.
Use this sizing framework to calculate your maximum position based on pool depth:
| Pool Liquidity | Max Pos. 1% | Expected Slippage | Break-Even Gain* |
|---|---|---|---|
| $50,000 | $500 | ~2% | ~14% |
| $100,000 | $1,000 | ~2% | ~14% |
| $250,000 | $2,500 | ~2% | ~14% |
| $500,000 | $5,000 | ~2% | ~14% |
| $1,000,000 | $10,000 | ~2% | ~14% |
*Assumes 2% spread + 2% slippage. Adjust based on actual fees.
Who You Are Trading Against: Bots and Market Makers
In low-liquidity markets, you are not trading against other retail investors making emotional decisions. You are trading against automated systems designed to extract value from your orders.
Automated market makers (AMMs) on decentralized exchanges like Uniswap do not use order books. They use liquidity pools governed by a constant product formula (x × y = k). When you buy, you remove one asset from the pool and add another. The price adjusts algorithmically based on the ratio shift. The larger your trade relative to the pool, the worse your price.
Front-running and sandwich bots monitor the mempool (pending transactions) and insert their own orders ahead of yours. A sandwich attack works like this: the bot sees your $10,000 buy order, places its own buy order first (pushing the price up), lets your order execute at the higher price, then immediately sells into your order for a profit. You pay more, and the bot walks away with the difference. Academic research shows these attacks occur frequently on DEXs and cost traders millions annually.
Wash trading bots create fake volume by trading with themselves. A bot buys from one wallet and sells to another wallet it controls, generating the appearance of activity. The project team uses this to make the token look liquid and actively traded. Real traders see the volume, enter positions, and then discover there is no genuine liquidity when they try to exit. You can spot wash trading by analyzing transaction counts versus volume. If a token shows $200,000 in daily volume but only 50 unique transactions, those are likely large, repetitive bot trades rather than organic market activity.
The 12-Point Liquidity Assessment Checklist
This checklist is your pre-trade audit. Each point includes the metric to check, the threshold that signals danger, and where to verify it. Use this framework before entering any position in a token with under $1 million in daily volume.
Use this matrix as a quick-score filter before diving into the full 12-point audit:
| Metric | Good | Caution | Danger |
|---|---|---|---|
| Volume/Market Cap Ratio | 2-10% | 1-2% | <1% or >50% |
| Bid-Ask Spread | <0.5% | 0.5-2% | >2% |
| Daily Volume | >$500K | $100K-$500K | <$100K |
| Top 10 Holder Concentration | <30% | 30-50% | >50% |
1. Volume-to-Market Cap Ratio
What to check: Daily trading volume as a percentage of market cap.
Healthy threshold: 2-10% of market cap traded daily.
Red flag: Under 1% signals a stagnant market. Over 50% may indicate manipulation or pump-and-dump activity.
Where to verify: Check CoinMarketCap, or Dexscreener. Divide 24-hour volume by fully diluted market cap.
Why it matters: A low ratio means most holders are not actively trading. Your order becomes a disproportionate share of daily activity, making you the price setter rather than a price taker.
2. Bid-ask Spread Analysis
What to check: The percentage difference between the highest bid and lowest ask price.
Healthy threshold: Under 0.5% for established tokens. Under 1% is acceptable for smaller caps.
Red flag: Spreads exceeding 2% mean you are paying a significant premium to trade. This cost applies to both entry and exit.
Where to verify: On a DEX like Uniswap, the spread is visible in the swap interface. On a CEX, check the order book depth chart.
Why it matters: The spread is a guaranteed cost. A 2% spread means you lose 4% round-trip before any price movement.
3. Liquidity Lock Duration
What to check: Is the liquidity pool locked, and for how long?
Healthy threshold: Liquidity locked for at least 6-12 months via a time-lock contract (Unicrypt, Team.Finance).
Red flag: Unlocked liquidity or locks expiring within 30 days. This allows developers to remove liquidity instantly (a “rug pull”).
Where to verify: Dextools displays a “Liquidity Locked” badge. You can also check the holders list on Etherscan or BscScan to see if LP tokens are in a lock contract or burn address.
Why it matters: Unlocked liquidity means the developer can drain the pool at any time, leaving you with worthless tokens and no way to sell.
4. Holder Distribution
What to check: What percentage of the supply do the top 10 holders control (excluding the liquidity pool and burn address)?
Healthy threshold: Top 10 holders own less than 30% combined. No single wallet (other than the contract or pool) holds more than 5%.
Red flag: One or two wallets holding 20%+ of supply. This creates dump risk. When a whale exits, the price collapses.
Where to verify: Etherscan, BscScan, or integrated holder charts on Dexscreener. Sort by “Holders” and calculate the top wallet percentages.
Why it matters: Concentrated ownership means one wallet can crash the market. You are at the mercy of their exit timing.
5. Transaction Count vs. Volume
What to check: Daily transaction count relative to reported volume.
Healthy threshold: At least 200-500 transactions per $100,000 in daily volume. This indicates diverse, organic trading.
Red flag: High volume with low transaction count (e.g., $200,000 volume with 30 transactions). This suggests wash trading by bots making large, repetitive trades.
Where to verify: Dextools or Dexscreener. Check the transaction feed for patterns of repetitive buys and sells from the same wallets.
Why it matters: Fake volume created by bots gives a false sense of liquidity. When you try to sell, there is no real buyer.
6. Buy/sell Tax
What to check: Does the token contract impose fees on buys or sells?
Healthy threshold: No tax, or a small tax (1-3%) that funds liquidity or marketing.
Red flag: Asymmetric taxes (e.g., 1% buy, 20% sell) or taxes that can be changed by the owner. This is a honeypot trap where you can buy but cannot sell profitably.
Where to verify: Token Sniffer or Honeypot.is. These tools simulate a buy and sell to detect hidden taxes.
Why it matters: A 20% sell tax means you lose 20% immediately upon exit. Combined with spread and slippage, you may need a 30%+ gain just to break even.
7. Contract Renouncement
What to check: Has the contract owner renounced ownership?
Healthy threshold: Ownership renounced (owner address is 0x000…000). This prevents the developer from changing contract parameters.
Red flag: Contract is still owned by a wallet. The owner can potentially mint new tokens, change taxes, or blacklist addresses.
Where to verify: Etherscan or BscScan. Go to the contract page, click “Read Contract,” and check the “owner” function. If it returns the zero address, ownership is renounced.
Why it matters: An un-renounced contract gives the developer god-mode control. They can rug the project or manipulate supply at will.
8. Exchange Tier
What to check: Where is the token listed?
Healthy threshold: Listed on at least one Tier 2 exchange (KuCoin, Gate.io, MEXC) or a reputable DEX with deep liquidity (Uniswap, PancakeSwap).
Red flag: Only available on a single, unknown DEX or a low-volume CEX. This limits your exit options.
Where to verify: CoinGecko or CoinMarketCap list all markets. Check the total liquidity across all venues.
Why it matters: Exchange listing quality affects your ability to exit. If the token is only on one obscure platform, you are trapped there.
9. Market Maker Presence
What to check: Is there a professional market maker supporting liquidity?
Healthy threshold: The project has disclosed a partnership with a reputable crypto market making firm (Wintermute, GSR, Keyrock). These firms provide continuous bid-ask quotes.
Red flag: No disclosed market maker, or market making done by anonymous bots. This increases the risk of manipulated spreads and fake volume.
Where to verify: Project’s official announcements, Medium posts, or Discord/Telegram channels. Reputable projects will publicly disclose their market maker relationships.
Why it matters: Professional market makers stabilize prices and provide genuine liquidity. Their absence means you are trading in a Wild West market.
10. Community vs. Bot Activity
What to check: Is social engagement organic or bot-driven?
Healthy threshold: Active, diverse community across Twitter, Discord, and Telegram. Conversations show varied opinions and genuine questions.
Red flag: Spam, repetitive messages, accounts with low follower counts and identical post patterns. This signals a bot-driven pump scheme.
Where to verify: Manually review the project’s social channels. Look for engagement quality, not just quantity.
Why it matters: Bot-driven hype creates artificial demand. When the bots stop, the buying disappears, and you are left holding the bag.
11. Historical Volatility
What to check: Price patterns over the past 30-90 days.
Healthy threshold: Gradual price growth with healthy corrections. Volatility within a predictable range.
Red flag: Repeated vertical spikes followed by 70-90% crashes. This is a classic pump-and-dump pattern.
Where to verify: Dextools or TradingView. Examine the price chart for suspicious patterns.
Why it matters: Tokens with pump-and-dump histories are controlled by coordinated groups who will dump on you at the peak.
12. The Exit Rail Test
What to check: Can you actually convert this token back to fiat or stablecoins?
Healthy threshold: The token can be swapped to ETH, USDT, or another liquid asset on a DEX, which you can then off-ramp via Paybis.
Red flag: The only path to fiat requires multiple swaps, obscure bridges, or centralized platforms with withdrawal restrictions.
Where to verify: Test the exit path manually. On Uniswap, check if you can swap the token for ETH or USDC. Then verify that Paybis or your preferred on-ramp supports those assets.
Why it matters: A token with no clear exit path is a one-way trade. You might be able to sell it for another illiquid token, but converting to fiat becomes a multi-step nightmare with compounding fees.
For more trading tips check out our Ultimate trading masterclass guide for 2025.
Tools of The Trade: Bots and Indicators
Manual research is critical, but tools accelerate the process. Here is the stack for auditing low-cap tokens.
Start with Dextools and Dexscreener for real-time price, transaction feeds, and the “Liquidity Locked” badge. Run the contract through Token Sniffer and Honeypot.is to detect sell restrictions and hidden taxes. Use chain explorers (Etherscan, BscScan) to manually verify holder distribution and liquidity lock addresses. If any tool flags the contract, stop there.
For advanced traders, AI-powered tools are emerging:
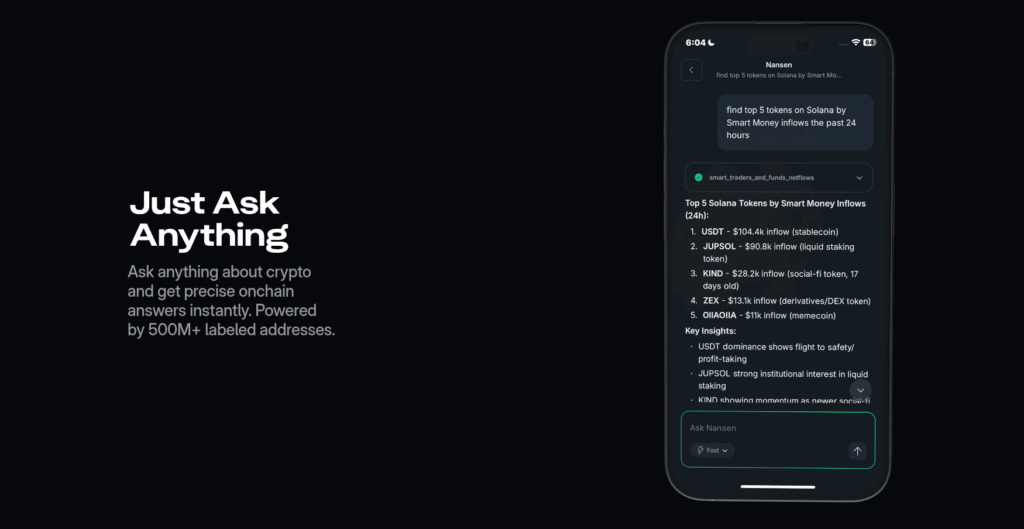
- Function: Wallet labeling and “Smart Money” tracking
- Best For: Identifying when experienced wallets enter or exit positions
- Cost: Free tier available; Pro plan $49/month (annual) or $69/month (monthly)
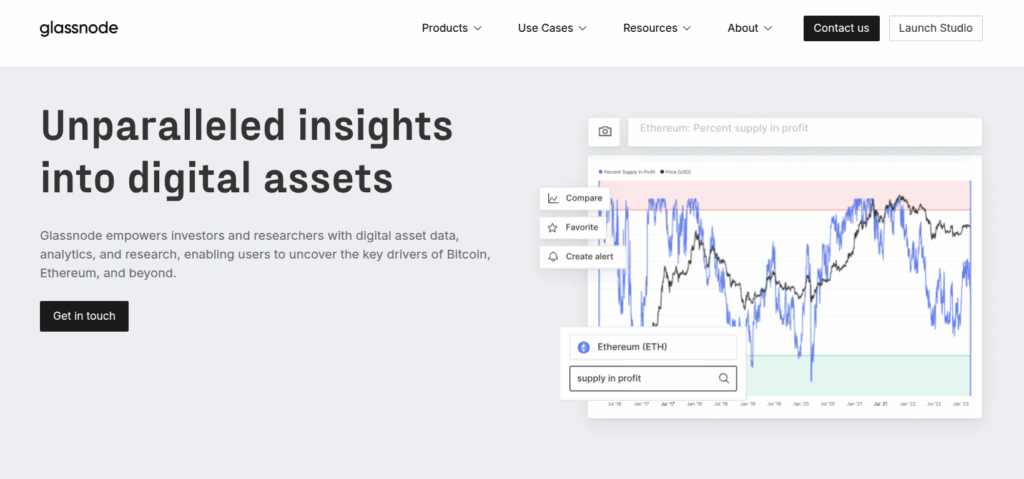
- Function: On-chain metrics and liquidity flow analysis
- Best For: Macro-level DeFi health and exchange balance trends
- Cost: Paid tiers ($29-39/month for Advanced; $699-799/month for Professional)
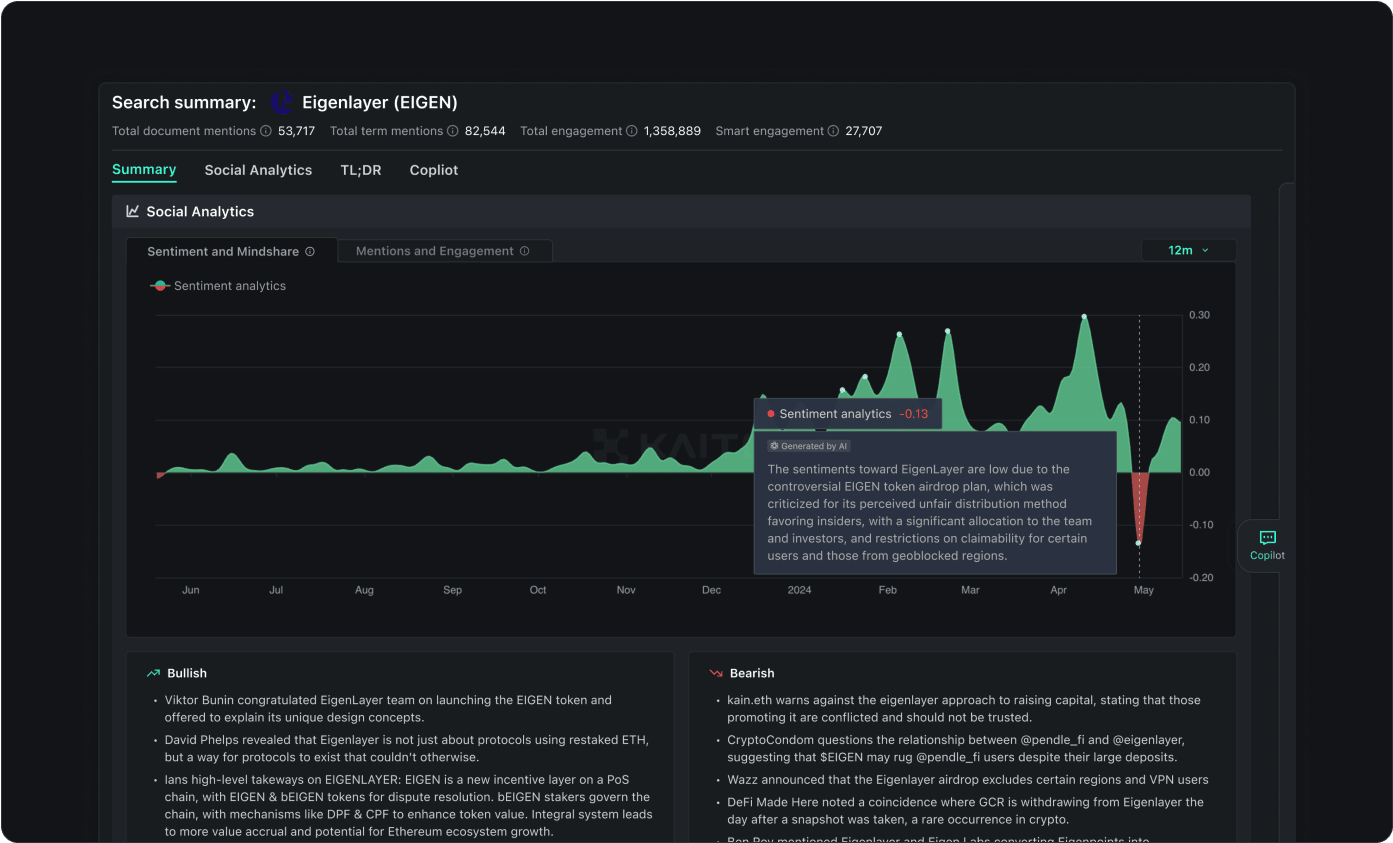
- Function: AI-driven sentiment analysis across Twitter, Discord, research
- Best For: Early narrative detection and sentiment shifts
- Cost: Premium subscription only (~$833/month Elite tier); 7-day free trial available
A realistic workflow for auditing a low-cap token:
- Discovery and contract security: Find the token on Dexscreener or Dextools. Run the contract address through Token Sniffer. If it fails, stop.
- Liquidity and holder verification: Verify on Dextools that liquidity is locked. Check the total pool value (minimum $50,000) and use the chain explorer to examine the top 20-30 holders.
- Social and transaction analysis: Review the project’s Twitter, Telegram, and Discord for genuine engagement. Watch the live transaction feed on Dextools for 5-10 minutes to spot bot patterns.
Our analysis of AI trading bots and machine learning in crypto breaks down how taders are integrating these tools.
Execution Strategy: Sizing, Entry, and The Exit Rail
Passing the 12-point audit does not guarantee profit. Execution determines whether you capture the opportunity or bleed capital to slippage.
Position sizing in low-liquidity markets:
The “1% of Liquidity” rule is conservative but effective. Your position size should be no more than 1% of the total liquidity pool. If a token has $100,000 in liquidity, your trade should not exceed $1,000.
This keeps slippage manageable and preserves your ability to exit without crashing the price. For AMM-based DEXs, larger trades experience disproportionately worse prices due to the constant product formula.
The entry: why speed matters:
When you identify a valid setup, execution speed is the difference between capturing the entry and chasing a pump. Low-liquidity tokens move fast. A 15% gain can happen in 30 minutes, and if you are waiting for a 3-day bank transfer to Coinbase or Binance, you miss it.
When your primary exchange fails during volatility, speed justifies the premium. Paybis verification takes 2 minutes for most users. Card purchases of crypto process within 10-15 minutes, and you can send funds to your MetaMask or trading wallet immediately. When Binance blocks your card (common during volatile periods) or Coinbase imposes a 3-5 day ACH hold, Paybis processes the transaction and gets you into position.
For a visual walkthrough of the process, watch this guide on how to send and withdraw Bitcoin or altcoins on Paybis.
Paybis’ edge is speed. If waiting 3 days means missing a 20% move, you need to ensure you capture your gains without having to wait around on the sidelines.
The exit: do not round-trip your bags:
This is where most low-liquidity traders lose. They hit their profit target, attempt to sell, and watch slippage erase 30-50% of the gain. To minimize exit damage:
- Scale out in tranches: If you hold $10,000 worth of a token, do not sell it all at once. Sell $2,000 portions over time to avoid overwhelming the pool.
- Use limit orders on CEXs: If the token is listed on a centralized exchange, set limit sell orders at your target price. This avoids market order slippage.
- Monitor liquidity depth before exiting: Check the order book or pool depth before selling. If liquidity has dropped since your entry, adjust your expectations or exit smaller.
Once you have converted your position to stablecoins or ETH, getting to fiat matters. If your primary exchange is congested or blocking withdrawals (common during high volatility), Paybis lets you convert crypto to fiat and receive it via bank transfer or card. The same speed advantage applies: when Binance has a 24-hour withdrawal queue, Paybis processes it in under an hour.
Understanding bid and ask price dynamics can further refine your exit strategy, as the spread widens significantly during volatile periods in low-liquidity markets. Avoid low liquidity traps with Paybis’ native speed to capture your upside today.
“I appreciate Paybis for its ability to facilitate instant cryptocurrency purchases using my card, which significantly enhances the efficiency of my transactions.” – Verified user review of Paybis
Ready to deploy capital when you spot a setup? Do not let slow banking rails cost you the entry. Paybis offers 2-minute verification and 10-15 minute processing for card purchases, getting you into position before the opportunity closes. When it is time to exit, convert to fiat without waiting for congested exchanges. First-time buyers pay zero Paybis service fees.
Key Terminology
Slippage: The difference between the expected trade price and the actual execution price, caused by low liquidity or high volatility.
Wash trading: Artificial volume created by bots trading with themselves to give the illusion of liquidity and activity.
Honeypot: A token contract that allows buying but prevents selling through hidden code or asymmetric taxes.
Liquidity pool: On DEXs, a smart contract holding reserves of two tokens that enable automated trading via constant product formulas.
Front-running: A bot strategy that monitors pending transactions and inserts its own order ahead of yours to profit from the price movement you create.
Order book depth: The total volume of buy and sell orders at various price levels, indicating the market’s ability to absorb large trades.
Market maker: A firm or entity that provides continuous buy and sell quotes to stabilize prices and improve liquidity in a trading pair.
FAQ
What is a liquidity rug pull?
A rug pull happens when developers remove all liquidity from the pool, making the token unsellable. Liquidity lock contracts prevent this by time-locking LP tokens for 6-12 months minimum.
How do market makers influence low-cap prices?
Professional market makers provide continuous bid-ask quotes, stabilizing prices and narrowing spreads. In their absence, bot-driven manipulation is common.
Can AI bots predict liquidity crunches?
AI tools like Nansen and Glassnode analyze wallet behavior and on-chain flows to identify liquidity exits early. However, they flag patterns, not guarantees. For more on this, read our breakdown of AI’s role in cryptocurrency trading.
What is the difference between centralized and decentralized exchange liquidity?
On CEXs, liquidity is measured by order book depth at each price level. On DEXs, liquidity is the total value locked in the AMM pool. Both impact slippage, but DEX slippage is algorithmically determined and non-linear, meaning larger trades experience disproportionately worse prices.
How often should I re-audit a token I am holding?
Weekly at minimum. Liquidity can be removed, holder distribution can change, and bot activity can increase. Set alerts on Dextools for significant liquidity changes or large holder movements.
Disclaimer: Don’t invest unless you’re prepared to lose all the money you invest. This is a high‑risk investment and you should not expect to be protected if something goes wrong. Take 2 mins to learn more at: https://go.payb.is/FCA-Info