

Ethereum Price History: From the ICO to Today, and What Moves ETH

- Ethereum launched through a 2014 ICO at roughly $0.31 per token. ETH first traded on exchanges at about $2.77 in August 2015, then fell below $1 within days.
- ETH’s all-time high is close to $4,950, set on 24 August 2025. Its all-time low was about $0.43 on 19 October 2015 (CoinGecko).
- The 2026 drawdown took ETH from that peak to a June low near $1,500, a fall of about 70%, followed by a partial recovery in the second half of the year.
- Ethereum has crashed by more than 70% before, in 2018 and 2022, and later set new highs both times. Past recoveries do not guarantee future ones.
- Six factors do most of the work in moving ETH’s price: macro conditions, Bitcoin correlation, ETF flows, staking supply lock-up, network usage and fee burn, and upgrades or competition.
- Paybis lists the live ETH rate and lets you buy ethereum with fees shown in full before you confirm.
- This article covers price history and the drivers behind it. It does not make price predictions.
Crypto assets can increase or decrease in value. Paybis is a payment gateway, not an investment service. This content is for informational purposes only and does not constitute financial advice.
Quick Answer: Ethereum launched through a 2014 ICO priced at roughly $0.31 per token. ETH first traded near $2.77 in August 2015, then fell to an all-time low of about $0.43 that October (CoinGecko). Its all-time high is close to $4,950, set on 24 August 2025. ETH fell to roughly $1,500 in early June 2026, a drawdown of about 70%, and has traded near $2,400 in late October. Six factors drive most of its moves: macro conditions, Bitcoin correlation, ETF flows, staked supply, network usage and the fee burn, and upgrades or competition.
Ethereum is still the second-largest cryptocurrency by market cap, sitting well behind Bitcoin but far ahead of everything else. It’s had one of the roughest years of any major coin in 2026. ETH hit an all-time high of nearly $4,950 in August 2025, then fell to around $1,500 by June 2026, a drop of about 70%. It has since recovered to trade near $2,400 as of late October.
This guide covers Ethereum’s full price history, from the ICO to today. It explains what drove each major rise and crash, plus the factors that move ETH’s price. It does not make price predictions, and it does not tell you what to do with the history.
This covers Ethereum’s full price history and the six factors that actually move ETH, not a price forecast. If you’ve read the history and want ETH itself rather than just watching the chart, the live rate and calculator are below.
What Is Ethereum?
Anyone can build financial products on the Ethereum protocol, from tokens and decentralized exchanges to lending platforms and stablecoins. That flexibility is why Ethereum became the backbone of DeFi in the years after its ICO-era popularity spike in 2017.
A lot has changed since then. ICOs are largely a thing of the past, but Ethereum’s role as the leading smart contract platform has held up. It now underpins most of the DeFi market and a large share of stablecoin activity. It is also increasingly used as a settlement layer for tokenized real-world assets. Franklin Templeton runs part of its tokenized fund platform on Ethereum, and public companies now hold ETH directly as a treasury asset the same way some hold Bitcoin. One firm, Bitmine Immersion Technologies, held 6.02 million ETH as of 4 October 2026. That is about 4.9% of the total supply, roughly 89,000 ETH short of its stated 5% target (Bitmine company filing, October 2026).
From Mining to Staking: How Ethereum Changed
Ethereum used to run on the same mining system as Bitcoin, where computers competed to solve puzzles for new ETH. That changed in September 2022 with an upgrade known as the Merge, which switched the network to proof of stake. Instead of mining, holders now stake their ETH, locking it up to help secure the network in exchange for protocol rewards.
That shift has had a lasting effect on Ethereum’s supply and demand. As of October 2026, about 43.7 million ETH is staked, roughly 36% of the total supply. That locks up a large share of the circulating supply rather than leaving it on exchanges ready to sell. You can read more about how this transition worked in Paybis’s Ethereum Merge explainer.
With that background covered, let’s look at how Ethereum’s price has actually moved since then.
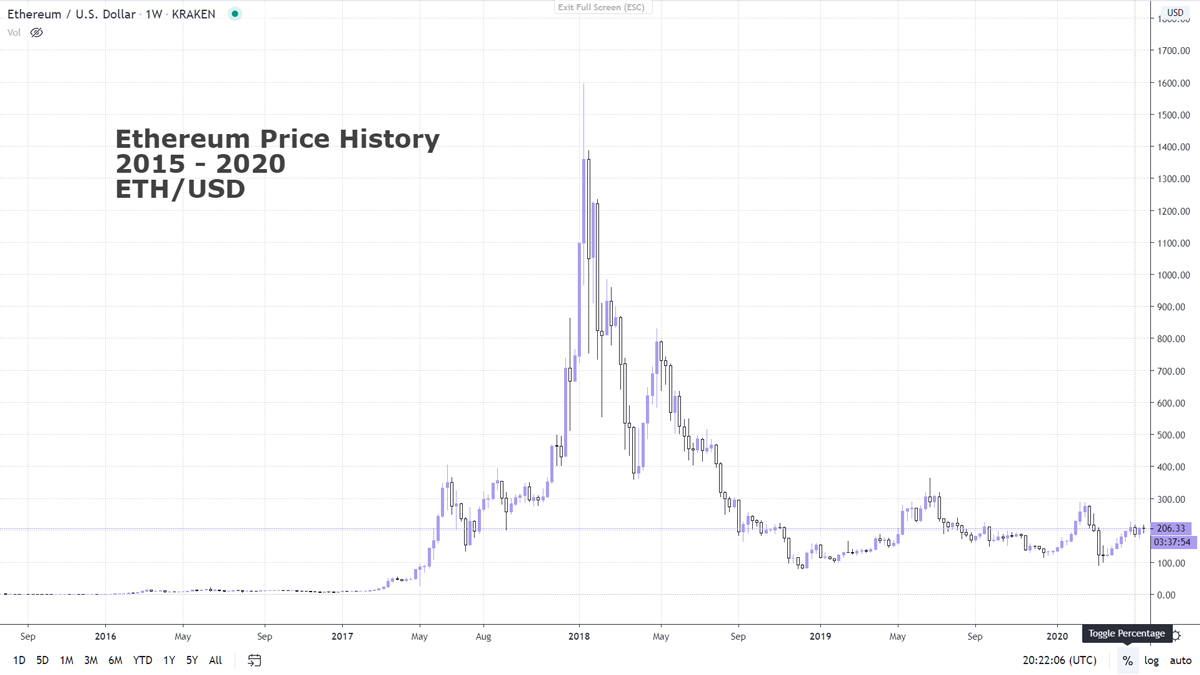
Ethereum Price Milestones at a Glance
| Date | Milestone | Price |
|---|---|---|
| Aug 2014 | ICO | About $0.31 |
| Aug 2015 | First exchange trading | About $2.77 |
| 19 Oct 2015 | All-time low | About $0.43 |
| Mar 2016 | First break above $10 | $10+ |
| Jan 2018 | ICO-boom peak | About $1,400 |
| Dec 2018 | Post-boom bottom | Under $100 |
| Nov 2021 | Prior-cycle high | About $4,880 |
| Jun 2022 | Bear-market low | Under $1,000 |
| 24 Aug 2025 | All-time high | About $4,950 |
| Jun 2026 | 2026 low | About $1,500 |
| Oct 2026 | Current | About $2,400 |
Figures from CoinGecko, verified 23 October 2026.
Ethereum Price History: Era by Era
Ethereum’s price history breaks into a few defining stretches.
2014-2016: The Launch Years
Ethereum raised its initial funding by selling ETH at roughly $0.31 in 2014, and the network went live in July 2015. ETH first traded on exchanges at about $2.77 on 7 August 2015, then fell below $1 within days. It bottomed at an all-time low of about $0.43 on 19 October 2015. ETH crossed $10 for the first time in March 2016, as the first smart contract applications appeared.
2017-2018: The ICO Boom and Bust
Startups raised money by issuing tokens on Ethereum, and demand for ETH followed, from about $95 to nearly $1,400 in roughly a year. When the ICO market collapsed, so did the price, back under $100 by December 2018. That fall of over 90% remains Ethereum’s deepest drawdown.
2019: A Quiet Year
2019 was flat by comparison. ETH ranged between roughly $100 and $365 across the year, setting neither a new high nor a new low.
2020-2021: DeFi and NFTs
The second great run was driven by usage rather than fundraising. Decentralized exchanges, lending markets, and NFT trading all ran on Ethereum. ETH reached roughly $4,880 in November 2021.
2022: The Bear Year and the Merge
ETH fell under $1,000 in the industry-wide 2022 collapse. In September that year the network completed its switch to proof of stake. The upgrade cut energy use by over 99% and changed how new ETH enters circulation.
2023-2025: ETFs and a New High
Spot Ethereum ETFs launched in the US in July 2024, and institutional access widened. ETH set its current all-time high of close to $4,950 on 24 August 2025.
2026: Drawdown and Partial Recovery
ETH fell steadily through the first half of 2026, hitting a low near $1,500 in early June, about 70% off its peak. It recovered through the second half of the year, trading near $2,400 by late October. Ethereum still tends to move in the same direction as Bitcoin during major market swings. 2026 has shown some periods where ETH moved independently, including stretches where Ethereum ETF inflows outpaced Bitcoin ETF inflows.
What Moves Ethereum’s Price
Six factors have done most of the work in every major ETH move, including 2026’s:
1. Macro conditions. ETH trades like a risk asset. Inflation data, interest-rate policy, and risk appetite in equities have moved it sharply in both directions. The 2026 drawdown tracked exactly that kind of macro pressure.
2. Bitcoin. ETH still tends to move with Bitcoin during large market swings. 2026 produced stretches where it moved independently, including periods when Ethereum ETF inflows outpaced Bitcoin’s.
3. ETF flows. Since US spot Ethereum ETFs launched in 2024, fund inflows and outflows have become a visible, measurable demand channel. It is one of the most-watched weekly numbers in the market.
4. Staking supply. About 43.7 million ETH was staked as of October 2026, roughly 36% of the total supply. Staked ETH is locked rather than sitting on exchanges, which changes how much supply is available to sell at any moment.
5. Network usage and the burn. Ethereum destroys a portion of every transaction fee, the EIP-1559 burn. Busy periods remove ETH from supply, while quiet periods let issuance outpace the burn. Usage is not just sentiment. It mechanically changes supply. The full supply picture is in the Paybis guide to how many Ethereum there are.
6. Upgrades and competition. Network upgrades shift Ethereum’s capacity and costs, and competing smart contract platforms contest the usage that drives points 4 and 5.
None of these produce a price target. They are the variables every forecast quietly depends on, which is also why forecasts disagree so widely.
Ethereum’s Biggest Drawdowns
| Period | Peak to Trough | Depth | What Followed |
|---|---|---|---|
| 2018 | About $1,400 to under $100 | Over 90% | New high in 2021 |
| 2022 | About $4,880 to under $1,000 | About 80% | New high in 2025 |
| 2025-26 | About $4,950 to about $1,500 | About 70% | Partial recovery, ongoing |
Ethereum has been through repeated deep drawdowns and has, so far, set a new high after each completed cycle. That is a description of the past, not a promise about the future. Past performance does not indicate future results.
Useful Links
- Ethereum Price
- Ethereum Calculator
- Ethereum vs Bitcoin: Key Differences
- Bitcoin Price Prediction 2026
- Buy Ethereum on Paybis
- How Many Ethereum Are There
How to Follow and Buy ETH on Paybis
The live ETH price and the Ethereum calculator show the current rate and convert any amount in either direction. Buying takes minutes. Create a Paybis account and verify your identity in about 2 minutes with a photo ID and a selfie. Choose Ethereum and an amount, then pick from 35 payment methods. Fees start from 1.49%, and the first card transaction has a 0% service fee. Service, processing, and network fees are itemized on screen before you pay.
Treating a price target as a promise
This article covers price history and drivers, not predictions. Past drawdowns (2018, 2022, 2025-26) were all followed by recoveries, but that is a description of the past, not a guarantee about the future.
Confusing analyst forecasts with guarantees
Six factors drive ETH’s price (macro, Bitcoin correlation, ETF flows, staking supply, network usage and the burn, upgrades), and none of them produce a price target. Forecasts disagree because the inputs are genuinely uncertain.
No plan for volatility
ETH fell about 70% from its August 2025 all-time high (~$4,950) to its June 2026 low (~$1,500). A position sized without that swing in mind is a position sized wrong.
Buying based on hype alone
ETF inflows, staking levels, and network usage are measurable and worth checking before buying, rather than reacting to a single headline. See the Ethereum supply guide for the staking and burn mechanics.
Summing Up
Ethereum has been through a rough stretch in 2026, but the story underneath the price is different from 2018’s ICO bust. Back then, demand genuinely dried up. This time, staking activity, ETF inflows, and real usage in DeFi and tokenized assets have all stayed active even as the price fell. That doesn’t guarantee a recovery, but it’s a different setup than a demand collapse.
Where the price goes next is not something this article predicts. What the history shows is a pattern of deep drawdowns and, so far, recoveries driven by real usage. The six drivers above are what to watch if you want to understand the next move rather than guess it. Do your own research, and speak with a financial advisor before making investment decisions.
Key Terminology
All-time high (ATH): the highest price an asset has ever traded at. Ethereum’s is close to $4,950, set on 24 August 2025.
All-time low (ATL): the lowest price ever. Ethereum’s was about $0.43, on 19 October 2015.
Drawdown: the fall from a peak to the following low, measured in percent.
ICO (initial coin offering): the 2014-era fundraising method Ethereum itself launched with.
Bear market / bull market: extended periods of falling or rising prices.
Fee burn (EIP-1559): Ethereum’s mechanism that destroys part of every transaction fee, linking supply to usage.
FAQ
What Was Ethereum's Lowest Price in 2026?
Ethereum’s 2026 low came in early June at roughly $1,500, about 70% below the August 2025 all-time high. The price recovered through the second half of the year. Check the live ETH price for where it stands today.
What Is Ethereum's All-Time Low?
About $0.43, set on 19 October 2015, a few months after the network launched (CoinGecko). From that low to the August 2025 all-time high near $4,950, ETH’s price has moved more than 11,000 times over. That is why percentage moves matter more than dollar moves when reading its history.
What Is Ethereum's All-Time High?
Ethereum’s all-time high is close to $4,950, set on 24 August 2025. As of 23 October 2026, ETH trades near $2,400, about 51% below that peak.
What Happened to Ethereum 2.0?
Ethereum 2.0 was the original name for the network’s move from mining to staking. That upgrade, known as the Merge, was completed in September 2022. Ethereum has continued upgrading since then, including work on scaling improvements planned for later in 2026.
Why Did Ethereum Drop So Much in 2026?
There wasn’t one single cause. It reflects broader risk-off sentiment across crypto markets, macro pressure from interest rates and inflation data, and profit-taking after the 2025 rally to Ethereum’s all-time high.
What Price Did Ethereum Start At?
Ethereum sold in its 2014 initial coin offering at roughly $0.31 per token. ETH first traded on exchanges at about $2.77 on 7 August 2015, then fell below $1 within days. It first crossed $10 in March 2016.
Has Ethereum Recovered From Crashes Before?
Yes, twice at full scale. The 2018 crash took ETH down more than 90% from its ICO-boom peak, and the 2022 bear market cut it roughly 80% from the 2021 high. In both cases the network later set a new all-time high. That record describes the past only. Past performance does not indicate future results, and deep drawdowns can repeat.
Where Can I Check Crypto Prices in Real-Time?
You can get the real-time prices at Paybis, but the most popular crypto listing website is CoinMarketCap.
Disclaimer: Don’t invest unless you’re prepared to lose all the money you invest. This is a high‑risk investment and you should not expect to be protected if something goes wrong. Take 2 mins to learn more at: https://go.payb.is/FCA-Info




Aw, this was an exceptionally good post. Taking the time and actual effort to make a good article… but what can I say… I procrastinate a whole lot and don’t seem to get nearly anything done.