On-Balance Volume (OBV)
The on-balance volume (OBV) is an indicator of technical analysis that combines changes in volume and prices to measure the buying or selling pressures. It helps traders to identify trends as well as prospective reversals.
Table of contents
What is On-Balance Volume (OBV)?
The momentum oscillator, OBV, predicts price movements by gauging the flow of volume. Developed in the late 1960s by Joseph Granville, OBV’s underlying principle is that volume always leads to price.
Generally speaking, substantial upswings or downturns in volume may signal forthcoming changes in stock prices. It sums up the trading day’s volume and then divides it into positive days and negative days. Finally, it adds such volumes to its prior total with respect to upward or downward trends on stock charts.
How OBV Works
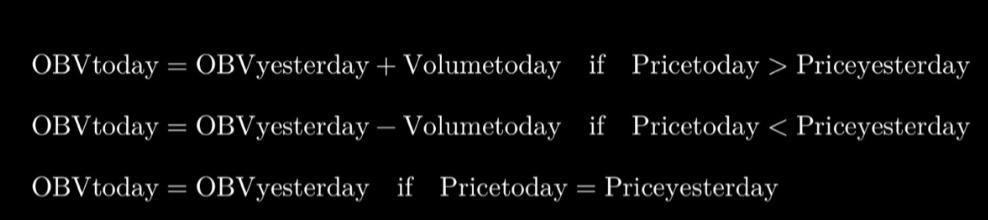
OBV works with a simple formula, adding or subtracting volume based on security closing prices.
- Volume addition: If, on any day, the closing price of the security is higher than it was the previous day, then the amount of its trading in stocks for that day will be added to the overall OBV.
- Volume subtraction: Conversely, if at any time during a given day, the closing price goes below what it was yesterday, then we will lower our OBV by the number of shares traded today
- Volume neutral: The OBV remains the same if the closing price is unchanged from the previous day.
This calculation creates a running total that rises and falls with the volume flow, helping traders identify buying and selling pressure.
OBV Calculation
The OBV calculation follows these simple steps:
- Current OBV Calculation:
- Initial OBV Value. The first step of OBV calculation starts with zero as an initial value. It is calculated by adding or subtracting volume based on price changes in subsequent values after the first trading day volume had been taken.
By understanding these steps, traders can see how OBV provides insights into market momentum and potential price movements.
Advantages of OBV
There are reasons why OBV has become popular among traders and analysts:
- Trend confirmation: It affirms a trend that is genuinely rising when its price rises with the OBV as well.
- Divergence detection: If prices go up but OBVs go down, then this rise seems to be running out of steam.
- Volume analysis: In order to take into consideration volume analysis through which decisions are made to trade in the stock market, and at the same time enabling one to identify such selling and buying pressures. OBV adds an extra bit of detail to what makes up movements in prices.
- Ease of use: This ease of calculation and understanding makes it accessible for all kinds of traders regardless of their experience level, making it easy for traders to interpret the data that it produces in an accurate way when being used by them.
That’s why many traders include the OBV in their technical analysis toolbox.
Using OBV in Trading
OBV is a versatile tool that can be used in different ways for trading purposes:
Trend Identification
Traders use OBV to identify and confirm trends. This occurs when both prices and OBS create higher highs and higher lows, confirming an uptrend, while lower highs and lower lows on the two indicators also confirm a downtrend respectively.
Divergence Analysis
Traders will look for divergences between OBV and price for possible reversals. A bullish divergence takes place when the price makes a lower low than before, but the indicator creates a higher low, implying upward momentum.
Breakout Confirmation
In cases of breakouts, OBV can ascertain them since if there is a significant rise in OBV during a price breakout above resistance, then it implies strong buying interest with the likelihood of lasting ascendancy ahead.
Volume Spikes
Non-traditional trading activity surges that reflect in OBV can be indicative of significant market shifts. Traders keep an eye on sudden alterations of the OBV to spot preceding price movements.
Drawbacks
However, there are some limitations to using OBV in trading:
- False signals. Sometimes, OBV may give false signals, particularly in cases where markets exhibit a high degree of volatility. The usage of other indicators and analysis techniques by traders is important to confirm any signal produced by an OBV.
- Lagging indicator. As a cumulative indicator, OBV lags behind price action. So it is necessary to use it as a part of a broader analysis instead of relying solely on it.
- Does not reflect price levels. Rather than showing actual prices, OBV is concerned with volume only. Therefore, whenever using this tool, traders must consider price patterns and levels that may exist concurrent with it.
Mastery of these limitations enables traders to realize better results.
Conclusion
The On-Balance Volume (OBV) serves as a great tool for technical analysis as it gives deep insights into the market’s buying and selling pressure levels. To enhance their strategies and improve their market analysis, traders can understand how OBV is calculated and used. While it is necessary to have the OBV included in our list of indicators and analysis techniques to validate signals, it must be combined with other indicators to confirm signals and make informed trading decisions.
FAQ
What is On-Balance Volume (OBV)?
OBV is a technical analysis indicator that combines changes in volume with price to determine buying and selling pressure. It helps identify trends and potential reversals in the market.
How can OBV be used in trading?
OBV can be used for trend identification, divergence analysis, breakout confirmation, as well as identifying volume spikes.
What are the limitations of OBV?
Shortfalls may include false signals, risk by lagging indicators, and no reflection of actual prices.
Disclaimer: Don’t invest unless you’re prepared to lose all the money you invest. This is a high‑risk investment and you should not expect to be protected if something goes wrong. Take 2 mins to learn more at: https://go.payb.is/FCA-Info