Solana vs Bitcoin in 2026: Paybis Purchase Data from 57 Markets
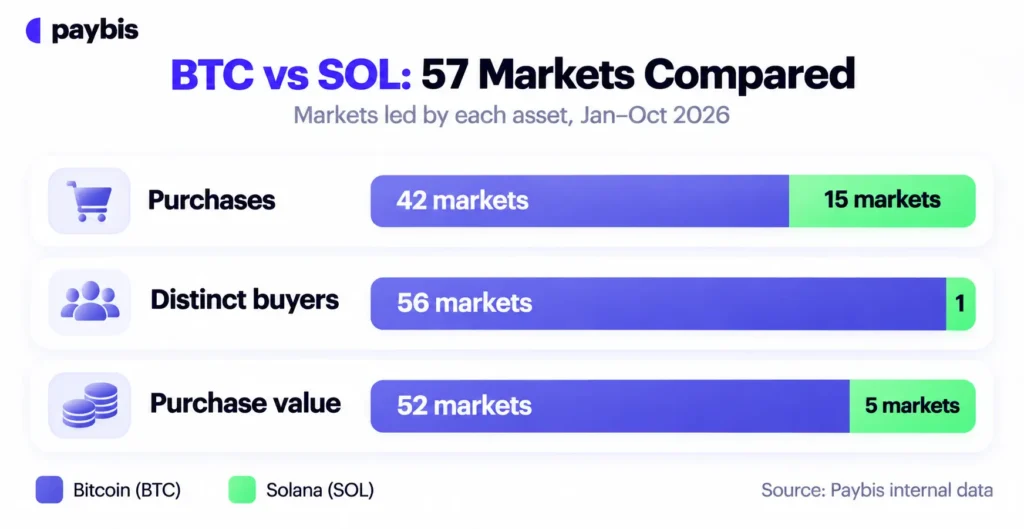
- Paybis data from January to October 2026 shows Solana recorded more successful purchases than Bitcoin in 15 of 57 markets.
- Paybis data from January to October 2026 shows Solana had more distinct buyers than Bitcoin in only one of those 57 markets: Lithuania (745 Solana buyers vs 401 Bitcoin buyers).
- Paybis data shows Bitcoin had a higher total purchase value and a higher average purchase value than Solana in all six markets analyzed in detail.
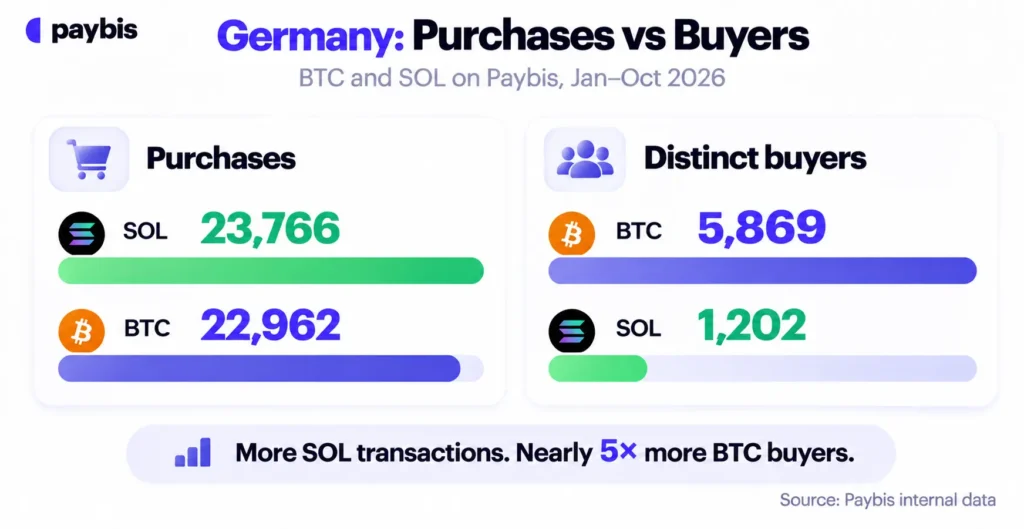
- In Germany, Paybis recorded more Solana purchases than Bitcoin purchases in every month from June to October 2026, while Bitcoin had more distinct buyers in every month.
- In October 2026, 962 Paybis customers with a German country record bought Bitcoin and 417 bought Solana.
- On Paybis in Germany, the average Bitcoin purchase was $406.20 and the average Solana purchase was $119.74.
- These figures describe Paybis customers only. They do not describe the wider cryptocurrency market in any country.
Is Solana more popular than Bitcoin?
On Paybis, it depends on what you count. Solana recorded more purchases than Bitcoin in 15 of 57 markets between January and October 2026, but Bitcoin had more distinct buyers in 56 of them and higher total purchase value in 52. Counting purchases, buyers and value separately gives a more careful answer than a single ranking.
A purchase count shows how often people bought. It does not show how many people bought, or how much they spent. Those three numbers can point in different directions, so Paybis compared them for Bitcoin (BTC) and Solana (SOL) in 57 markets and looked at six in detail.
In how many markets does Solana lead Bitcoin?
The study covered 57 countries with at least 500 combined Bitcoin and Solana purchases. Solana recorded more purchases than Bitcoin in 15 of them. Bitcoin led in the other 42.
A lead in purchase count rarely came with a lead in buyers. Solana had more distinct buyers in only one market, Lithuania. In Japan the two were close, with 113 Bitcoin buyers and 101 Solana buyers.
Solana also had a higher total purchase value in five markets: Albania, Kosovo, Kuwait, Morocco and the United Arab Emirates. All five are small. Solana volume in each ranged from $44,449 to $103,984. Bitcoin led in volume in the other 52 markets.
| Market | BTC purchases | SOL purchases | BTC buyers | SOL buyers |
|---|---|---|---|---|
| Germany | 22,962 | 23,766 | 5,869 | 1,202 |
| Lithuania | 1,423 | 6,926 | 401 | 745 |
| Slovenia | 866 | 1,973 | 199 | 51 |
| Estonia | 842 | 1,945 | 167 | 70 |
| Czechia | 1,026 | 1,679 | 268 | 87 |
| Kosovo | 412 | 1,196 | 106 | 72 |
| Kuwait | 282 | 920 | 111 | 30 |
| Japan | 331 | 824 | 113 | 101 |
| Albania | 401 | 816 | 135 | 66 |
| Ukraine | 547 | 550 | 164 | 49 |
| Türkiye | 376 | 492 | 67 | 32 |
| United Arab Emirates | 246 | 468 | 70 | 16 |
| Morocco | 260 | 454 | 109 | 63 |
| Puerto Rico | 299 | 333 | 75 | 20 |
| North Macedonia | 205 | 326 | 72 | 19 |
Ukraine is effectively level, with 550 Solana purchases and 547 Bitcoin purchases. Several markets rest on small buyer groups. Kuwait had 30 Solana buyers and the United Arab Emirates had 16. Read those rows as indicative.
How do the six detailed markets compare?
The table below shows successful purchases and distinct buyers from January 1 to October 31, 2026. A distinct buyer is counted once per asset. A customer who bought both assets appears in both columns.
| Market | BTC purchases | SOL purchases | BTC buyers | SOL buyers |
|---|---|---|---|---|
| Germany | 22,962 | 23,766 | 5,869 | 1,202 |
| Lithuania | 1,423 | 6,926 | 401 | 745 |
| Estonia | 842 | 1,945 | 167 | 70 |
| Slovenia | 866 | 1,973 | 199 | 51 |
| United States | 285,970 | 34,023 | 25,043 | 2,014 |
| United Kingdom | 15,691 | 306 | 2,168 | 13 |
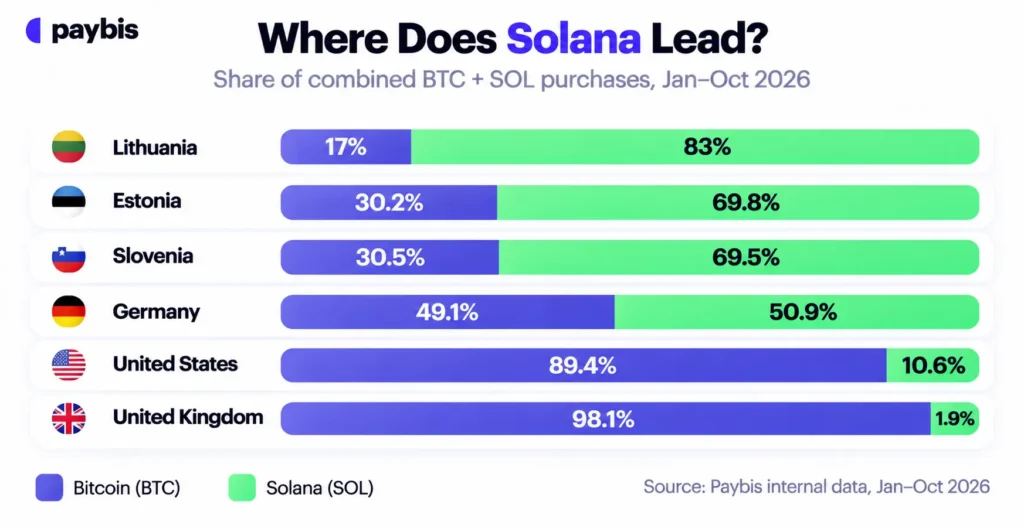
Solana recorded more purchases in Germany, Lithuania, Estonia and Slovenia. Bitcoin recorded more purchases in the United States and the United Kingdom.
The buyer columns add detail. In Germany, Estonia and Slovenia, Bitcoin had more distinct buyers than Solana despite fewer purchases. Lithuania is the exception.
The table below shows Solana as a share of combined Bitcoin and Solana activity on Paybis. These are shares of the two assets on Paybis, not market shares. Buyer shares are approximate because customers who bought both assets are counted twice.
| Market | SOL share of purchases | SOL share of buyer counts | SOL share of volume |
|---|---|---|---|
| Lithuania | 83.0% | 65.0% | 47.5% |
| Estonia | 69.8% | 29.5% | 37.4% |
| Slovenia | 69.5% | 20.4% | 30.8% |
| Germany | 50.9% | 17.0% | 23.4% |
| United States | 10.6% | 7.4% | 4.7% |
| United Kingdom | 1.9% | 0.6% | 0.8% |
In every market, Solana’s share is largest for purchases and smaller for volume. Germany shows the gap clearly: Solana made up 50.9% of combined purchases and 23.4% of combined volume.
Is Bitcoin or Solana bigger by purchase value?
Bitcoin leads on total volume in all six markets. It also has the higher average purchase in all six.
| Market | BTC volume (USD) | SOL volume (USD) | Avg. BTC purchase | Avg. SOL purchase | BTC average vs. SOL |
|---|---|---|---|---|---|
| Germany | $9,327,177 | $2,845,818 | $406.20 | $119.74 | 3.4x |
| Lithuania | $519,137 | $469,651 | $364.82 | $67.81 | 5.4x |
| Estonia | $215,434 | $128,593 | $255.86 | $66.11 | 3.9x |
| Slovenia | $231,082 | $102,994 | $266.84 | $52.20 | 5.1x |
| United States | $101,857,043 | $5,056,030 | $356.18 | $148.61 | 2.4x |
| United Kingdom | $6,954,578 | $57,035 | $443.22 | $186.39 | 2.4x |
The gap is widest in Lithuania and Slovenia, where the average Bitcoin purchase was more than five times the average Solana purchase. Lithuania is also the closest market in total volume: Bitcoin led by about $49,000.
Do more people buy Solana in Germany?
Not on Paybis. Germany is the largest of the four markets where Solana leads on purchase count, and it has the most complete monthly record. Solana recorded more purchases than Bitcoin from June to October 2026, but Bitcoin had more distinct buyers in every month.
| Month (2026) | BTC purchases | SOL purchases | BTC buyers | SOL buyers |
|---|---|---|---|---|
| January | 2,009 | 1,396 | 773 | 161 |
| February | 2,001 | 1,794 | 769 | 165 |
| March | 2,159 | 1,548 | 794 | 177 |
| April | 2,265 | 1,807 | 876 | 210 |
| May | 2,722 | 2,537 | 1,082 | 228 |
| June | 2,554 | 2,628 | 1,070 | 258 |
| July | 2,039 | 2,185 | 904 | 226 |
| August | 2,470 | 2,533 | 984 | 323 |
| September | 2,298 | 3,501 | 905 | 398 |
| October | 2,445 | 3,837 | 962 | 417 |
Solana moved ahead in purchase count in June
Bitcoin recorded more purchases from January to May. Solana moved ahead in June and stayed ahead through October. The early lead was small: 2.9% in June, 7.2% in July and 2.6% in August. The gap widened to 52% in September and 57% in October.
Bitcoin kept the larger buyer base
Bitcoin had more distinct buyers than Solana in every month. In October, Bitcoin had 962 buyers and Solana had 417, so Bitcoin’s buyer count was 2.3 times Solana’s.
Solana’s monthly buyers still grew from 161 in January to 417 in October, an increase of about 159%. Bitcoin’s monthly buyers grew about 24%, from 773 to 962.
Purchase size stayed lower for Solana
Monthly average Bitcoin purchases in Germany ranged from $353.87 to $465.09. Monthly average Solana purchases ranged from $82.99 to $189.40.
How did the market behave over the same months?
Paybis activity is one view of demand. The wider market gives context for it, though the sources below do not explain Paybis customer behavior.
- Bitcoin. Bitcoin opened 2026 near $87,500 and closed October at $77,424, down 7.3% in the month, its weakest October since at least 2016, according to CryptoTicker’s monthly returns report. The same report puts Bitcoin about 11.5% lower year to date. Coinglass daily data shows a 2026 high of $97,860.60 on January 14 and a low of $57,747.80 on July 1.
- Solana. 3iQ’s October 2026 Solana update reports that SOL fell 19.3% in October, from $121.63 on October 4 to a close of $95.29 on October 31, and about 64% below its all-time high.
- Year to date. Admiral Markets put Solana about 10.4% lower for 2026 as of October 12, after a September high near $124.62, its highest level since January. Solana ended October lower still, so its year-to-date loss was larger than Bitcoin’s by the end of the period.
Read side by side, both assets fell in October, with Solana falling by more. Paybis Solana purchases in Germany were at their highest in September and October (3,501 and 3,837), the same two months in which Solana was weaker. The data cannot say why, and the two series should not be treated as cause and effect.
What stands out in Lithuania?
Lithuania is the only one of the 57 markets studied where Solana led on both purchases and distinct buyers. Solana recorded 6,926 purchases against 1,423 for Bitcoin, which is 83.0% of combined activity. Solana had 745 distinct buyers and Bitcoin had 401.
Bitcoin still led in value. Lithuanian Bitcoin purchases totaled $519,137 and Solana purchases totaled $469,651. The average Bitcoin purchase was $364.82 and the average Solana purchase was $67.81.
How should Estonia and Slovenia be read?
Solana made up about 70% of combined purchases in both markets, and Bitcoin had more distinct buyers in both. The buyer groups are small: Estonia had 70 Solana buyers and Slovenia had 51. A few active customers could change the result, so treat both markets as indicative.
What do the United States and United Kingdom show?
Bitcoin dominates purchase counts in both. Solana was 10.6% of combined purchases in the United States and only 1.9% in the United Kingdom.
The United States is by far the largest market in the study, with 285,970 Bitcoin purchases recorded on Paybis. The UK Solana figures rest on 13 distinct buyers. They are shown for completeness and are not interpreted.
Why are Solana purchases smaller?
The data shows that the average Solana purchase was lower than the average Bitcoin purchase in all six markets. It does not show why. The points below are hypotheses, not findings.
Hypotheses (not tested by this data):
- Lower price per coin. A lower unit price may make smaller purchases feel normal for some customers.
- Repeat small purchases. Customers may buy Solana more often in smaller amounts, which would raise purchase count without raising buyers or value.
- Use as a working balance. Some customers may buy small amounts of Solana to use on the network rather than to hold.
- Price weakness. Solana’s fall in September and October may have encouraged more frequent, smaller buying.
Testing any of these would need data this study does not include, such as repeat-purchase rates per customer.
Methodology
- Data source. Paybis internal transaction database.
- Country. Each purchase is assigned to the country of the customer’s identity document when one was provided. Otherwise, it is assigned to the country of the IP address used for the transaction. Country therefore shows where a customer’s records point and may differ from where the customer lives.
- Period. January 1 to October 31, 2026.
- Included. Successful consumer purchases of Bitcoin and Solana. Business transactions are excluded.
- Markets. The study first reviewed 57 countries with at least 500 combined Bitcoin and Solana purchases. Six markets are analyzed in detail.
- Definitions.
- Purchase: one successful transaction.
- Distinct buyer: one unique customer account, counted once per asset.
- Volume: the summed transaction value in US dollars.
- Average purchase: total volume divided by purchase count.
- Outside market data. Price figures in the market context section come from the third-party sources linked there and are not Paybis data. Sources differ slightly in how they measure year-to-date change.
Bottom line
Purchase counts alone can mislead. In Germany, Solana recorded slightly more purchases than Bitcoin, yet Bitcoin had far more buyers and a much larger share of volume. Reading all three measures together gives a more accurate view of Paybis activity.
FAQ
Is Solana more popular than Bitcoin?
On Paybis, not by most measures. Solana recorded more purchases than Bitcoin in 15 of 57 markets from January to October 2026, but Bitcoin had more distinct buyers in 56 of the 57 and higher total value in 52.
Do more people buy Solana in Germany?
No. In Germany, Bitcoin had more distinct buyers than Solana in every month of 2026. In October, 962 Paybis customers with a German country record bought Bitcoin and 417 bought Solana, although Solana recorded more purchases (3,837 vs 2,445).
Did Solana overtake Bitcoin in Germany?
Only on purchase count. Solana recorded more successful purchases than Bitcoin in each month from June to October 2026. Bitcoin still had more distinct buyers and a higher total purchase value in that period.
Which cryptocurrency do customers in Germany prefer?
This data cannot answer that. It covers Paybis customers and shows how often they bought, how many bought and how much they spent.
Why is the average Solana purchase smaller?
The data shows the difference but not the reason. The average Solana purchase was lower than the average Bitcoin purchase in all six markets. See the hypotheses above, which are not tested by this study.
Is Lithuania really different from the other markets?
Among the 57 markets studied, yes. Solana led on both purchases and distinct buyers there, while Bitcoin led on total value.
Disclaimer: Don’t invest unless you’re prepared to lose all the money you invest. This is a high‑risk investment and you should not expect to be protected if something goes wrong. Take 2 mins to learn more at: https://go.payb.is/FCA-Info