How To Read Crypto Charts and Candles – The Noobies Guide

The stock market has been around for a long time and any trader is probably familiar with multiple types of price charts. Well, nowadays, there’s a new class of digital assets that have taken the internet world by storm… cryptocurrencies.
As a logical followup, this new invention has opened up an alternative market for traders: crypto trading. In a market of this kind, one takes advantage of the rising and falling prices of different crypto coins and tokens, instead of trading stocks or jumping on the forex bandwagon.
Cryptocurrency trading is generally performed on cryptocurrency exchanges. Since the conception of cryptocurrencies, trading them has become a popular alternative to the stock market among the blockchain community.
And just like with any other market, cryptocurrency exchanges often use trading charts to help traders easily visualize & determine the next move the market will take. In this article, we’ll be covering how to read crypto charts that are most popular.
Let’s get into it!
Table of contents
- What Are Crypto Charts?
- How To Read Crypto Charts
- The Simplest Price Charts
- How to predict Crypto Charts
- How To Read Candlestick Charts
- Bar Charts
- Moving Average Convergence Divergence (MACD) Charts!
- Wrapping Up
- FAQ
- 1. Are crypto graphs reliable indicators for price predictions?
- 2. What’s crypto chart market capitalization?
- 3. Is it important to know how to read crypto graphs?
- 4. Are there any further resources to learn how to read cryptocurrency charts?
- 5. Can I use what I’ve learned on charts to figure out how much to buy?
- 6. What if my chart analysis points to an opportunity in a different asset?
- 7. Do these charts work for altcoins too, not just Bitcoin?
- 8. Where do I actually go to buy once I’ve spotted my entry?
- 9. How do I decide which coins are even worth analyzing?
- 10. What does a bullish trend on a chart actually mean in broader market terms?
What Are Crypto Charts?
If you’re completely new to trading in general, you may be wondering: “what ARE crypto charts?” There are many types of price charts out there, but they’re all essentially graphic displays of current prices, trading volumes, and the overall momentum of the market. Cryptocurrency traders use these charts to help determine when to buy, when to sell, and when to HODL. That is why it is important to learn how to read crypto charts.
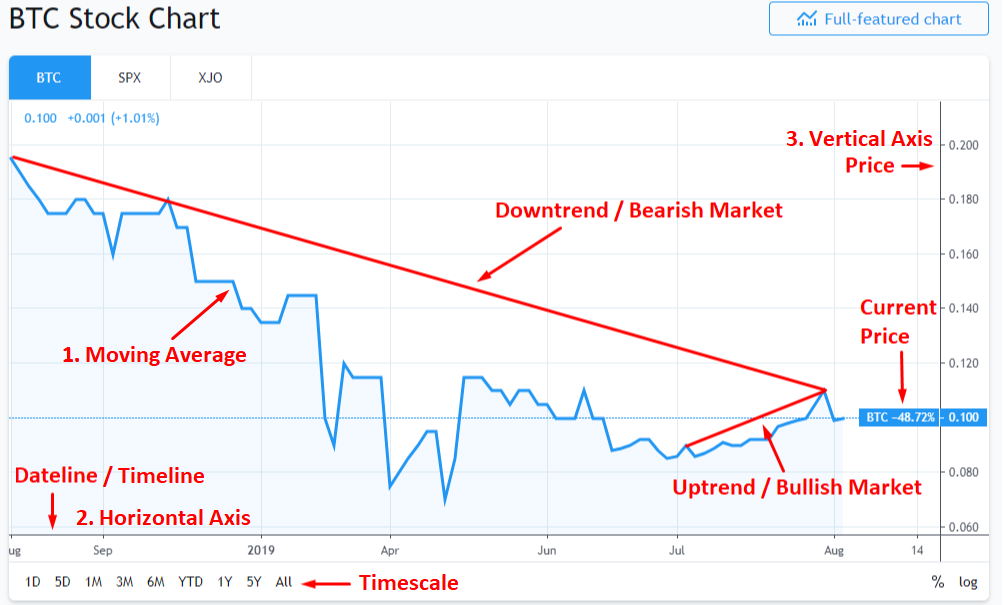
TradeView.com Bitcoin Line Chart – Screenshot By Author
Above, you’ll see an example of a simple Bitcoin line chart (we’ll discuss this later below).
Here’s a breakdown of some of its basic elements:
- The moving average (the blue jagged moving line). This plots the price of BTC as it moves along the timeline.
- The horizontal axis (bottom). This tells you the timeline that the graph is following, which can be changed (in this example: 1 Day, 5 Days, 1 Month, 3 Months, 6 Months, Year To Date, 1 Year, 5 Years, All).
- The vertical axis (right hand side). This shows you the price of BTC at any point along the chart.
By using a simple chart like this, you can tell whether the market is in a bullish or bearish trend. A bullish trend means the price is more prone to increase in value (going up), while a bearish trend tends to be responsible for a decrease in value (going down). Such trends can be long term or short term.
Those are the basics when it comes to the movements of the market. If you want to put all that into practical application for your trades you can read our article on how to “buy the dip”.
See? Reading cryptocurrency charts is not that difficult. The real talent emerges when you make the right assumptions as to when to get in and out of a particular market based on recognizing the expected market trends. And the first step of doing that is recognizing what you’re looking at.
How To Read Crypto Charts
Crypto charts come in different shapes and sizes. Knowing how to read them, including how to read Bitcoin charts (and any other) is much easier than you might think.
In this article we’ll be covering some of the most important charts that cover the basics. Are you ready? Let’s dive into it.
The Simplest Price Charts
The first stop in our journey on how to read crypto price charts is a standard combo of a line chart and a volume chart. Line charts display a simple line showing the historical price points of an asset, while a volume chart shows its historical trading volumes. For crypto, these are generally made up of the daily closing prices within a particular time frame.
Time frames for chart viewing can often be measured in minutes, 1 hour, 4 hours, a day, a week, a month, 3 months, 6 months, 1 year, or all time (among others).
How to understand crypto charts – 9 variables to keep in mind
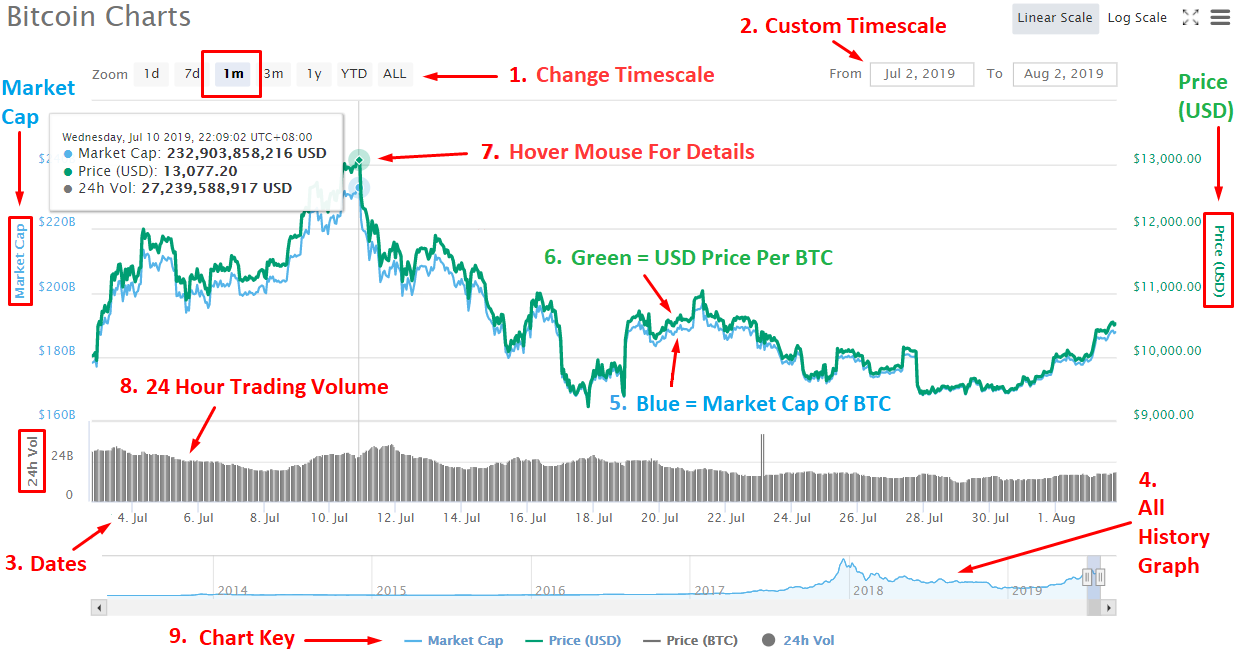
Above is a basic chart for BTC. This particular one has quite a few features:
- A timescale setting (this one is set for 1 month) as seen above the graph. Using the “Zoom” feature (top left) you can quickly choose 1 day, 7 days, 1 month, 3 months, 1 year, YTD (Year To Date), or ALL.
- A custom timescale option (top right).
- Dates along the bottom of the graph. Just below the graph you’ll see (in this case) the days of the month.
- An all history graph (below the dates) with a bar to let you drag the date range as you see fit.
- A blue line correlating to the left side of the chart, representing Bitcoin’s market cap.
- A green line correlating to the right side of the chart, representing BTC’s price in USD.
- Hovering the mouse over the line in this particular chart will give you a detailed information pop-up for that point in time.
- A secondary chart in black underneath the line chart & just above the dates. To the left we see that this is the 24 hour trading volume.
- A key (very bottom) to help you understand some of the different elements.
These are the types of charts you’ll see (along with other information) on CoinMarketCap. There, you can read the cryptocurrency price charts of every crypto on the market, all 2,278 of them (as of July 23, 2019)! Reading simple price index charts is good for a general overview, but if you want to trade, you’ll probably want more data.
How to predict Crypto Charts
The best way to predict when a chart will show an uptrend movement is by understanding which variables allow a coin to increase in price. In this case, there are two things you should be aware of:
- The market sentiment surrounding a coin. You can read more about how to perform research for market sentiment here.
- The pattern that indicates an upcoming trend change. For that, you will need to learn more in-depth trading. You can start by learning everything in our cryptocurrency trading guide.
How To Read Candlestick Charts
Next, let’s discuss how to read crypto candlestick charts. These offer much more data than simple price charts and are among the most popular charts for traders. What other data do these charts show? I’m glad you asked…
A daily candlestick price chart is made up of (you guessed it) “candlesticks” (discussed further below). It shows the market’s opening & closing prices and the highest & lowest prices per day (or other time frames). It also quickly shows you if the price within that time frame ended positively or negatively.
The Chart
When taken together, the candlesticks form the moving average you would normally see in a line chart, but with more information (discussed in detail further below). You may occasionally see a doji, which looks like a cross or plus (✝) rather than a candlestick. A doji means that the opening and closing prices for the day were identical.
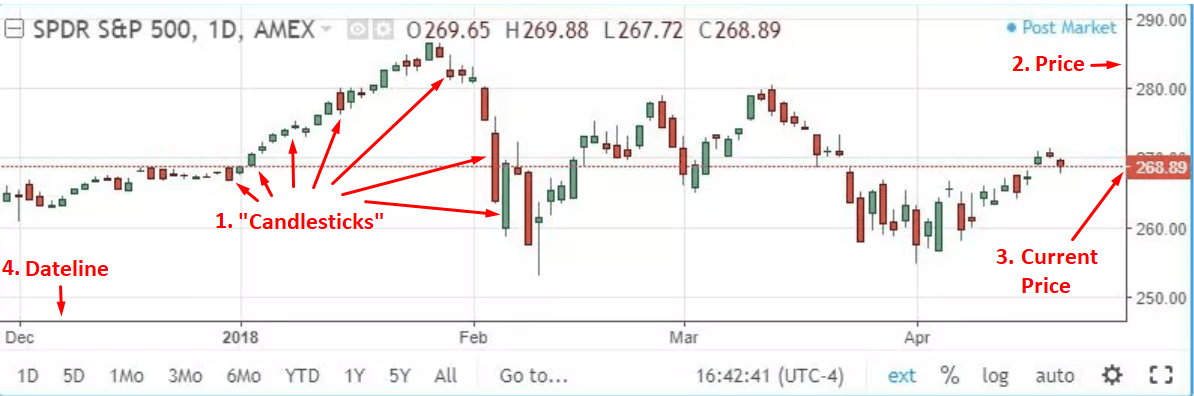
Above is a candlestick chart, composed of candlesticks (1). On the right hand’s vertical axis, one can see the price (2). Hovering your mouse on a particular point of the moving average should highlight the current price (3). The bottom horizontal axis shows the dateline (4).
Candlestick charts can be set to day charts, hourly charts, 15 minute charts, and even 5 minute charts, among others (longer and shorter). These time frames indicate the amount of time recorded per candlestick.
The Candlestick
A “candlestick” looks like a thick colored line (the “real body”) with a thinner line coming out the top and/or bottom of it (see “Candlestick Basics” image further below). This thinner line is called the upper/lower shadow or the upper/lower wick. The real body (the thicker part) represents the opening and closing prices for the time period of that candlestick. Whereas the shadow/wick (the thin vertical line) represent the highest and lowest prices for that candlestick’s time period.
Candlesticks come in two classic color styles (green/red or white/black). When the real body is black/red it means the close was lower than the open – the price went down. When it is white/green it means the close was higher than the open – the price went up.

Image By Author
Each candlestick will give you 5 points of data for each day (or whatever the set time frame is), which are:
- The highest price. This is the highest point on the candlestick (the upper wick/shadow).
- The lowest price. This is the lowest point on the candlestick (the lower wick/shadow).
- The opening price. On a green or white colored candlestick, the opening price is the bottom of the “real body”, on a red or black colored candlestick, the opening price is the top of the “real body”.
- The closing price. On a green or white colored candlestick, the closing price is the top of the “real body”, on a red or black colored candlestick, the closing price is the bottom of the “real body”.
- A quick color code. This quickly shows whether the price ended bullish (green/white) or bearish (red/black).
Let’s say, for example, that you were looking at a candlestick day chart for Bitcoin, where each candlestick represented a day. You pick a day and look at its candlestick. You notice that it’s green, so at least you know the closing price was higher than the opening price.
What was the opening price?
You hover your mouse over the bottom of the real body and follow the horizontal line to the vertical axis… it was $7,000 per BTC. And the closing price? You check out the top of the real body, it was $7,125 per BTC… not bad. Next, you want to see the lowest price for the day, so you take a look at the lower shadow and see that it was $6,982 per BTC. Lastly, you wish to see the highest price for the day, so you take a gander at the upper shadow. To your amazement, you see $1,000,000 per BTC (to the mooooooon!).Ok, so that probably wouldn’t happen, but it’s just an example.
Now you know how to read a candlestick chart. You’re well on your way to (hopefully) making some successful cryptocurrency trades. But you’ll more than likely need plenty of training and practice if you want to become a successful trader.
Reading crypto candlestick charts may look hard at first, but they’re really not that difficult. The hardest part will be learning and recognizing patterns and the art of the trade.
Here’s some more resources on mastering the candlestick chart:
–Candlestick charts: The ULTIMATE beginners guide to reading a candlestick chart
–The Ultimate Candlestick Patterns Trading Course
Your exchange may have live crypto charts for you to study. If not, then you can easily check out Tradeview.com to get a better idea of all the charting possibilities.
Let’s move on to the next on our list…
Bar Charts
We’ll make this one short and sweet (almost in passing), as bar charts are extremely similar to candlestick charts.
The Chart
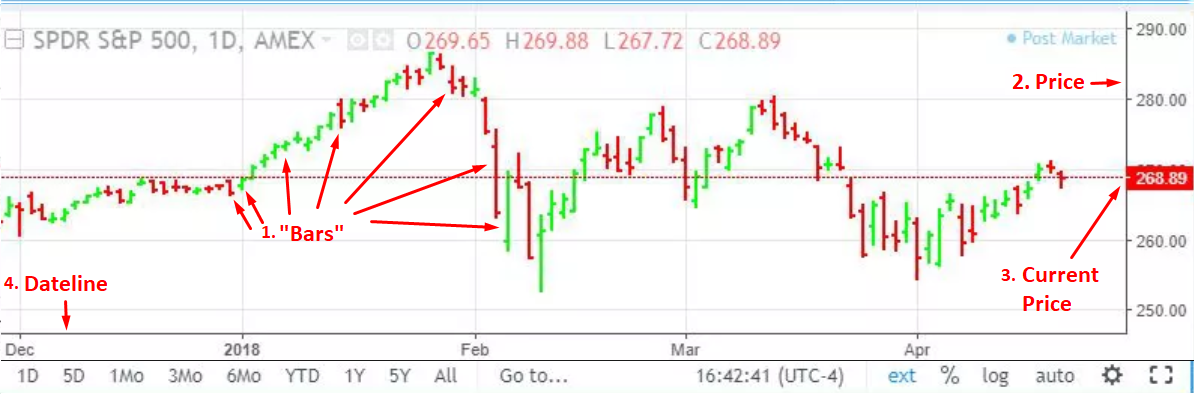
Investopedia.com Bar Chart – Screenshot By Author
A bar chart has the same basic elements to it, including bars (1) instead of candlesticks, the right hand vertical axis with the price (2), getting the current price (3) by hovering your mouse over a particular point, and the bottom horizontal axis with the dateline (4). The only difference is the bar.
The Bar
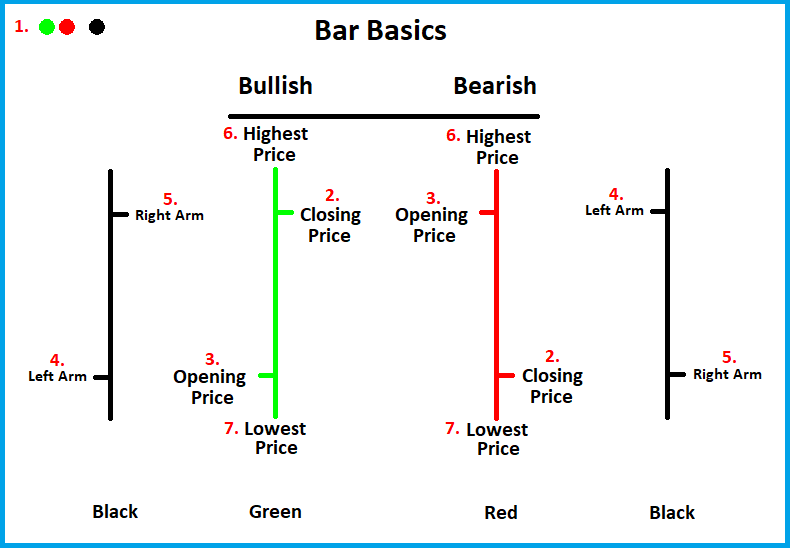
A bar comes in two classic color styles (1), green/red or black. Just like with candlesticks, a green bar means the closing price (2) was higher than the opening price (3), and a red bar means the opposite. With a classic black bar, you must determine whether it is bullish or bearish based on the position of the left and right arms. The left arm (4) shows the opening price, and the right arm (5) shows the closing price. The highest price (6) is determined by the top-most point of the bar, and the lowest price (7) is determined by the lowest point of the bar.
All in all, a bar chart is read nearly the same as a candlestick chart, and each bar gives the same exact details as with a candlestick (except that black bars are not color coded).
Moving Average Convergence Divergence (MACD) Charts!
This is one of my favorites, because it shows you when you can buy or sell. The MACD chart shows you the direction the markets are heading, and when they change direction (bullish or bearish). It’s a lagging indicator and is used to confirm a trend direction in the market. A basic MACD chart has three components to it:
- The MACD line
- The Signal line
- A Histogram
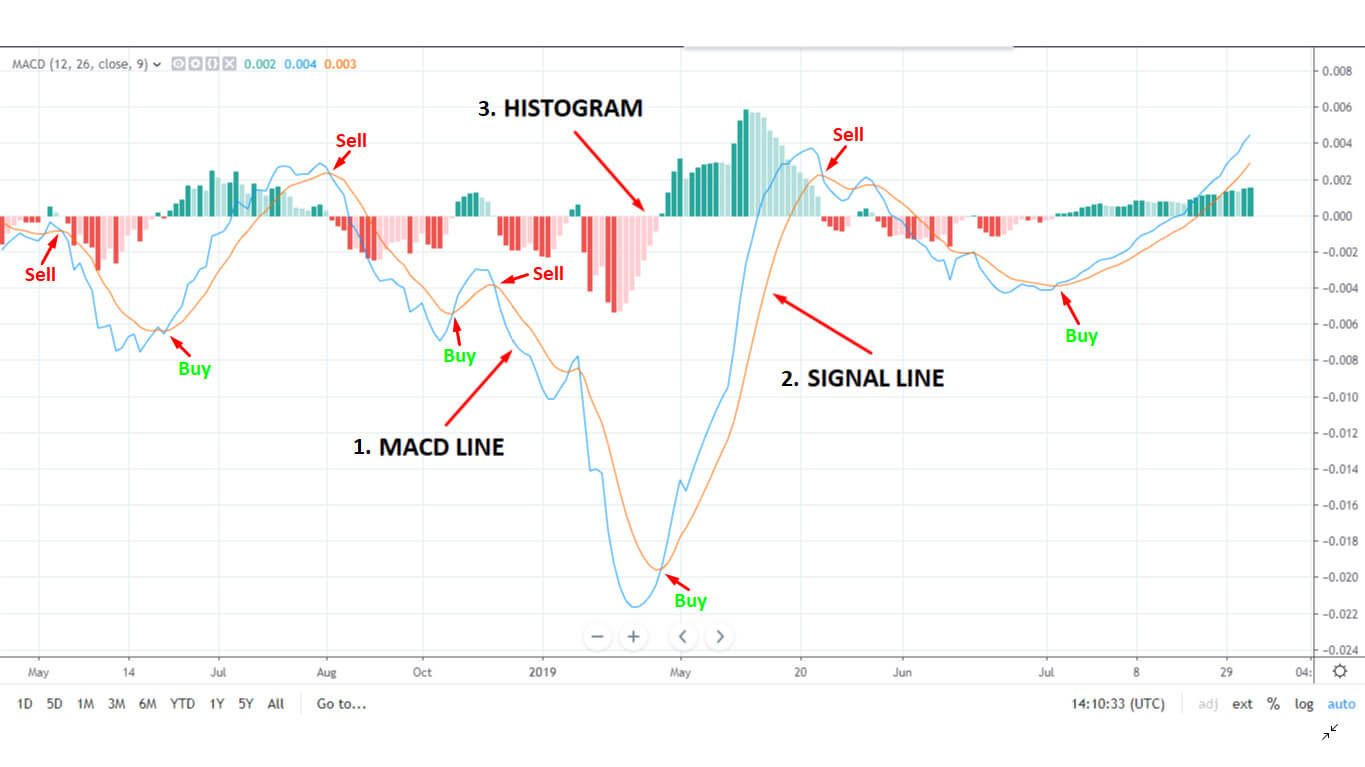
TradeView.com BTC MACD Chart – Screenshot By Author
The MACD line is normally the difference between 12 and 26 Day EMAs (Exponential Moving Averages). The Signal line helps to smoothen the price-sensitive MACD line and is normally the average of the MACD’s last 9 days. Parameters can be changed of course per trading strategy using the MACD Chart “Settings” options (see instructions below). Day traders, for example, may want faster signals and less lag time, and thus decide to change the MACD indicator’s default values (read more here). Apart from that, the Histogram (centerline of the chart) further shows the difference between the two lines.
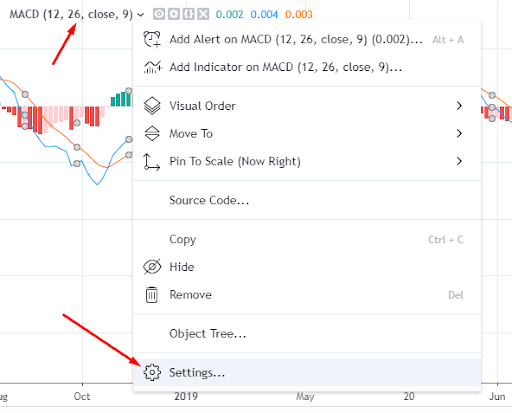
How To Change MACD Parameter Settings:
With TradeView.com’s MACD chart, simply click on “MACD (12, 26, close, 9)” on the upper left; Then click on “Settings…” at the bottom of the drop-down menu; Finally, you can adjust these settings.
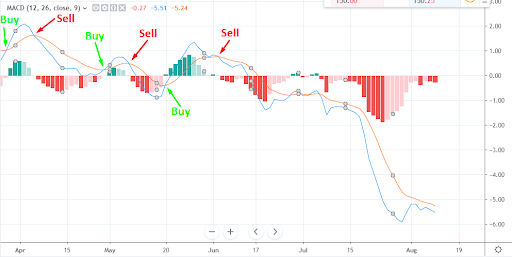
TradeView.com BTC MACD Chart – Changing MACD Settings – Screenshot By Author
When The MACD Line And Signal Line Cross
When the MACD line (illustrated in blue in the two photos above) is above the Signal line, traders can expect an upcoming bullish trend to occur. On the contrary, when the MACD line is below the Signal line, you may want to start preparing for a potential downtrend (or bearish trend) in the short-term future. The histogram adds another visual element to interpreting current and possible future line movements.
More On The Histogram
The histogram consists of an invisible “zero line”, green bars which rise above that line during an uptrend, and red bars which descend below the line during a downtrend. These bars become longer as the trend gets stronger. They switch from green to red (above and below the zero line) and vise-versa as the MACD and Signal lines cross over.
In simplified terms, each crossover point indicates buy and sell signals based on the change in direction of the market.
Mastering the MACD, like trading, will take learning and practice, but it does make things a lot simpler.
Here’s a video with some advanced techniques for using a MACD chart:
MACD Indicator Secrets: 3 Powerful Strategies to Profit in Bull & Bear Markets
For more information on what EMAs are and how they work in trading, you can see this article and also this one.
Wrapping Up
Now that you’ve learned how to read crypto charts, it’s time to take the next steps on your way to trading crypto.
1st, if you haven’t already, you should find a cryptocurrency exchange or a wallet with an exchange built-in. Feel free to check out this article about Coinbase vs Paybis Comparisons.
2nd, if that exchange doesn’t have adequate crypto price charts, you’ll need to find another place to get your charts, or perhaps download some software. One such source is cryptowat.ch, where you can practice reading cryptocurrency charts.
3rd, start learning technical price analysis. Learn the patterns and signals that professional traders look for. Here’s a cryptocurrency trading guide to get you started. One piece of advice that you should learn quickly is to buy the dips and sell the tops, and know how to do it. TradingView.com is also a great resource for traders, and has many free charts.
4th, if you can, start following a successful trader, and potentially getting trade alerts from them. However, having the right tools (like a MACD chart and a Candlestick chart for example) and following some basic safety procedures (like having a stop loss and not trading emotionally) should greatly help.
You may also want to see if you can find any of these charts for your favorite cryptocurrency. There’s also an interesting one called an RSI chart, or a Relative Strength Index chart, which is a momentum oscillator.
Well, we hope you’re well on your way to successfully trading cryptocurrency. Now that you know how to read crypto charts – keep on learning, seek help when you need it, and remember to put your knowledge into practice. Read those crypto charts!
Disclaimer: This article is intended for educational and entertainment purposes only. We cannot guarantee the information found within this article to be fully accurate or complete. This article is not intended to be taken as investment advice, and any actions taken as a result of having read the information contained in this article is strictly the responsibility of the action taker, and not the responsibility of Paybis. Readers are encouraged to do their own extensive research before investing into any particular market, and to never invest more than they are willing to lose.
FAQ
Here are some FAQs for those that still have unanswered questions.
1. Are crypto graphs reliable indicators for price predictions?
No. Even though cryptocurrency graphs allow more traders to conduct similar trading strategies and drive the price in a more controlled manner, time has shown that there is no way to accurately predict a coin’s future price movement.
2. What’s crypto chart market capitalization?
Cryptocurrency market capitalization is the total value (ingested financial amount) of one cryptocurrency or all cryptocurrencies as a total. Very often, you will hear people referring to an eventual “1 trillion dollar market cap”. What they mean by that is the total valuation of all cryptocurrencies (the market).
3. Is it important to know how to read crypto graphs?
Knowing how to read cryptocurrency graphs is important if you are swing trading. For long term investors, however, it offers little benefit.
4. Are there any further resources to learn how to read cryptocurrency charts?
Yes. There are many forums and groups on Facebook where you can find useful information on advanced chart reading. You can start by checking Crypto Coin Trader.
5. Can I use what I’ve learned on charts to figure out how much to buy?
Yes. Once you’ve spotted a potential entry point on the chart, a Bitcoin calculator helps you quickly work out how much BTC your budget gets you before you place a trade.
6. What if my chart analysis points to an opportunity in a different asset?
That happens a lot. If your technical analysis signals a momentum shift between assets, you can swap BTC to ETH quickly without going through a full exchange setup.
7. Do these charts work for altcoins too, not just Bitcoin?
Absolutely. Candlestick and MACD patterns apply across all crypto assets. If ETH is showing an uptrend on your chart, you can buy Ethereum directly and act on that signal straight away.
8. Where do I actually go to buy once I’ve spotted my entry?
Once you feel confident reading the charts and you’ve found your entry point, you can buy crypto quickly and securely through Paybis without needing a complicated exchange account.
9. How do I decide which coins are even worth analyzing?
Chart reading only gets you so far if you’re looking at the wrong assets. Our guide on how to choose which cryptos to invest in helps you narrow down which coins deserve your attention before you start analyzing them.
10. What does a bullish trend on a chart actually mean in broader market terms?
A bullish trend on your chart often signals the start of a bull market, where prices are rising broadly across the crypto space and buying pressure is building. Understanding the bigger picture behind that signal helps you trade with more confidence.
Disclaimer: Don’t invest unless you’re prepared to lose all the money you invest. This is a high‑risk investment and you should not expect to be protected if something goes wrong. Take 2 mins to learn more at: https://go.payb.is/FCA-Info