We Compared 22 Crypto Platforms’ Fees to Find Out What You’re Actually Paying
- Only 1 in 22 platforms in this study showed the full cost before checkout. Most reveal it only after you have entered your card details
- 88.9% of users in the study preferred seeing exact fee amounts in their currency over percentages, and 84.9% wanted a full breakdown rather than a single bundled total
- Payment method is the single biggest variable in how much crypto you receive. On a $5,000 USDC purchase, switching from a card to a SEPA bank transfer returns 139 more USDC on the same platform
- ACH bank transfers achieved a 100% buy win rate across all comparisons in the dataset, meaning every US bank transfer comparison returned more crypto on Paybis than on the competitor tested
- On a 0.05 BTC sell via SEPA, the difference versus one competitor in a single snapshot was €449.88
- The advertised fee percentage is not the full cost. The spread, the payment processing cost, and the network fee all shape what you actually receive, and few platforms name all three before you confirm
Paybis has been processing crypto transactions since 2014. Over that time, we observed that one question came up in support conversations more than any other: “Why did I receive less than I expected?”
The answer was always a combination of the same things: the spread inside the exchange rate, the payment processing cost, and the network fee. All real costs are present in every transaction. But almost never explained clearly before the user clicked confirm.
In 2026, we decided to measure it properly. We ran a usability study on how people respond to different ways of presenting fees. We audited how 22 platforms disclose their costs. We compared net crypto received across those platforms at multiple transaction sizes and payment methods. This article presents what we found.
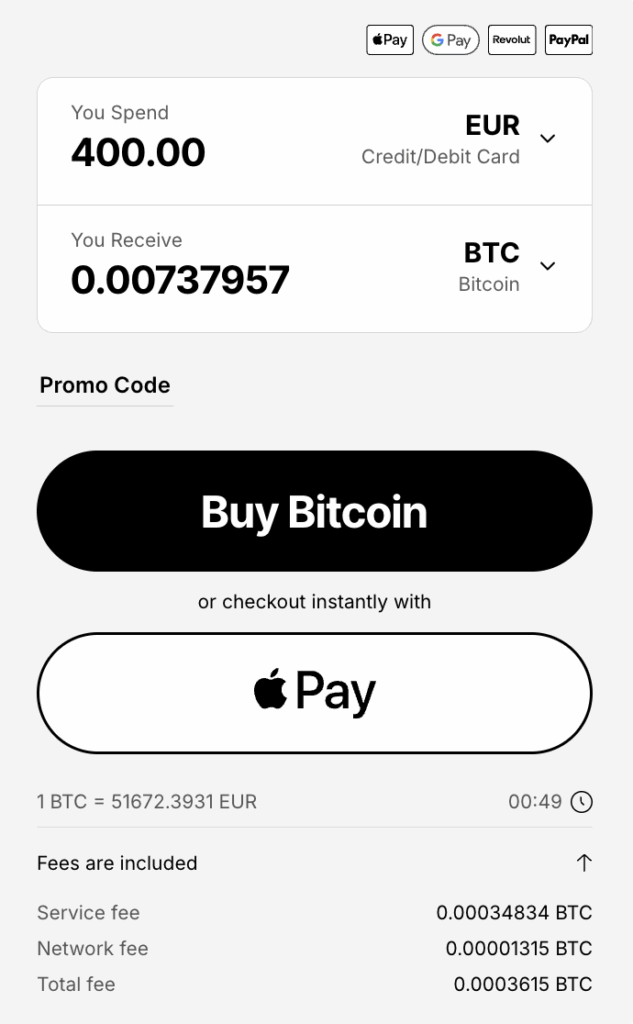
If you want to see how Paybis displays costs today, the quote screen shows every fee in dollars before you confirm:
Why did Paybis run the fee clarity research?
Because fee confusion in crypto is not accidental. Most platforms are designed to show you the minimum possible information before you commit. We wanted to quantify how widespread that is and what it costs users.
The “fee” problem in crypto is well known at a surface level. Everyone knows there are fees. But fewer people know that the advertised percentage is often one of the smaller costs, that the spread inside the exchange rate can dwarf the named fee. Or, paying by card instead of bank transfer can cost you more than the platform fee itself.
Paybis is not neutral in this conversation. We have an interest in claiming our fees are fair. That is exactly why we measured it the way we did: not by comparing advertised percentages, but by measuring what actually lands in the user’s wallet. A platform cannot hide a bad result that way.
We also wanted to understand what users actually want to see at a quote stage, because the industry default of a single checkout total shown at the last moment is a choice that makes comparison harder.
How did we measure crypto fees?
Rather than comparing advertised fee percentages, we measured net received: the actual crypto or fiat delivered to the user after all costs. A platform with a higher advertised fee can still return more crypto if its spread is smaller. Net received captures the full picture; percentages do not.
Transactions were tested at $100, $1,000, and $5,000 across two assets (Bitcoin and USDC) and all major payment methods, across 22 platforms in total.
For buy comparisons, we measured how much Bitcoin or USDC a user received for a fixed dollar spend. For sell comparisons: we measured how much fiat a user received for a fixed amount of crypto sold.
All figures reflect a single point-in-time snapshot. They are not a guarantee of future results, since rates, spreads, and platform pricing change with market conditions.
The usability component ran separately. Real users were shown different fee display formats and asked to choose between them and explain their preference. The results informed how Paybis presents fees today.
What do users actually want when exchanges show them their fees?
The usability study gave users a choice between a single bundled total, a percentage breakdown, and a full itemised breakdown in exact currency amounts. The preferences were not close.
84.9% of participants chose a full fee breakdown over a single total number.
88.9% preferred seeing exact amounts in their currency (euros or dollars) rather than percentages.
64.3% favoured seeing each fee labelled separately: Paybis fee, network fee, payment fee, rather than a bundled “service fee” line.
The reasoning users gave was direct. One participant said they wanted to see where every cent goes so they could compare it against other platforms. Another said the network fee was important information that felt strange to leave out. A third said percentages meant nothing to them. They wanted to see the total value in money they understood.
The one exception was a preference among some users for a simpler grouped display. The reason: they did not know what “payment fee” meant as a label. The solution, which informed the final design, was to group costs into readable lines while explaining what each line contains.
What did the platform transparency audit find?
Of the 22 platforms reviewed, only 1 showed the full cost to the user before the checkout stage. The majority revealed the total only after the user had entered card details. Several did not publish their fee structure publicly at all.
This is the context that makes fee comparison so difficult. If you want to know what a transaction will cost on most platforms, you have to begin the purchase, enter your payment details, and read the number that appears at the end. By that point, the friction of starting again on another platform is enough to stop most people.
Some platforms fold all costs into the exchange rate, so the fee section of the checkout shows 0% or a low percentage while the spread adds 1-2% invisibly inside the rate. Others show a fixed percentage at the start and reveal additional costs only at the checkout total.
The net effect is that comparing platforms by their advertised fee is close to useless. Two platforms can show the same percentage and deliver completely different amounts of crypto, because the spread and processing costs that sit outside the named fee are different.
What does the data show by payment method?
Payment method turned out to be the biggest single variable in net received, bigger than the choice of platform in many comparisons. ACH transfers came out ahead in every buy comparison in the dataset. SEPA was the strongest method for selling.
The table below summarises win rates across all comparisons in the dataset. A win means Paybis delivered more net crypto or net fiat than the competitor tested for that transaction.
| Payment method | Best for | Buy win rate | Sell win rate |
|---|---|---|---|
| ACH (US bank transfer) | Buying BTC or USDC | 100% | n/a |
| SEPA (EU bank transfer) | Buying or selling | 62% | 95% |
| Skrill | Selling | n/a | 100% |
| Credit or debit card | Selling; buying at $1,000+ | 39% | 64% |
| Google Pay | Buying BTC | 59% | n/a |
| Apple Pay | Buying USDC at $5,000+ | 44% | n/a |
| PayPal | No clear use case | 9% | n/a |
A few findings worth pulling out of that table:
ACH’s 100% buy win rate means every single US bank transfer comparison in the dataset returned more crypto on Paybis than on the competitor. We are not talking about the majority; it applies to every comparison.
Apple Pay’s 44% overall win rate understates its potential on large USDC purchases. On a single $5,000 USDC buy compared against one competitor, the Apple Pay gap was 672 USDC. The average matters, but so does knowing where the outliers sit.
SEPA’s 95% sell win rate reflects the sell side being an area most users overlook entirely. On a 0.05 BTC sell via SEPA, the difference versus one competitor in this snapshot was €449.88. People who focus only on buy-side fees and accept whatever the sell side offers are leaving a significant amount on the table.
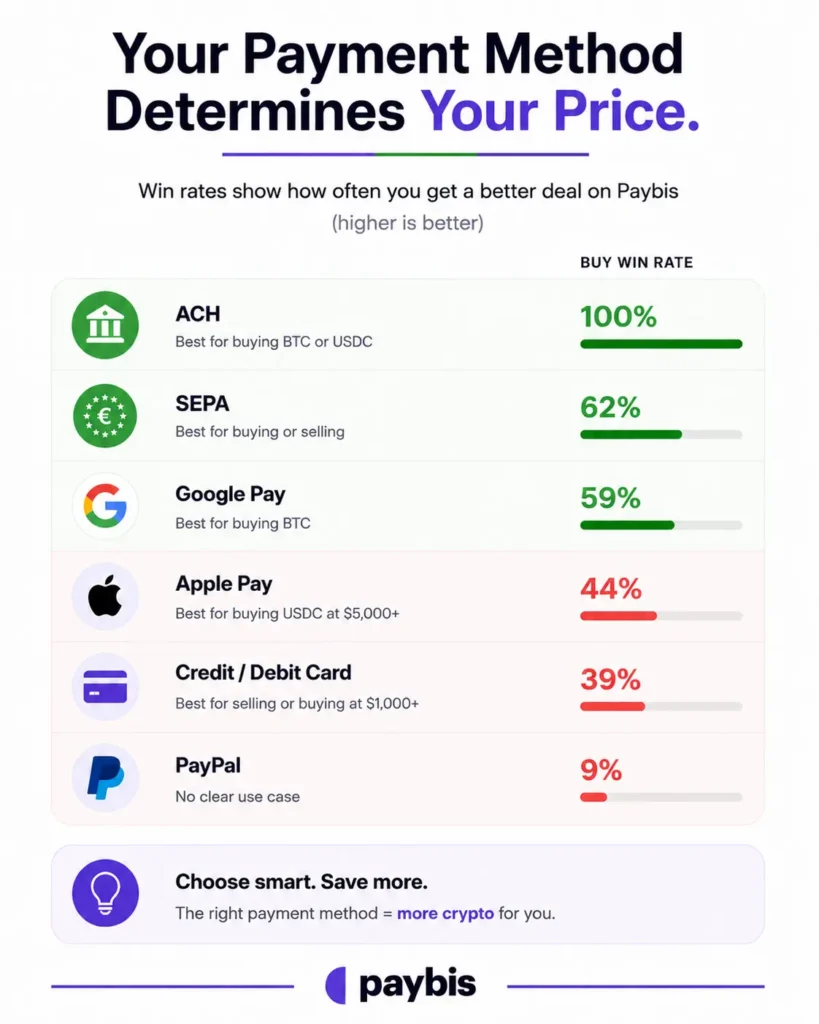
PayPal’s 9% buy win rate across the dataset is a clear signal. In nine out of ten buy comparisons, another payment method returned more crypto for the same spend.
What does the data show by transaction size?
The percentage gap between platforms is fairly stable across transaction sizes. The dollar gap is not. At $5,000, a 13% advantage in crypto received translates into several hundred dollars of additional crypto. At $100, the same percentage is a much smaller absolute amount.
The comparison between Paybis and one competitor for buying BTC with a card illustrates this clearly:
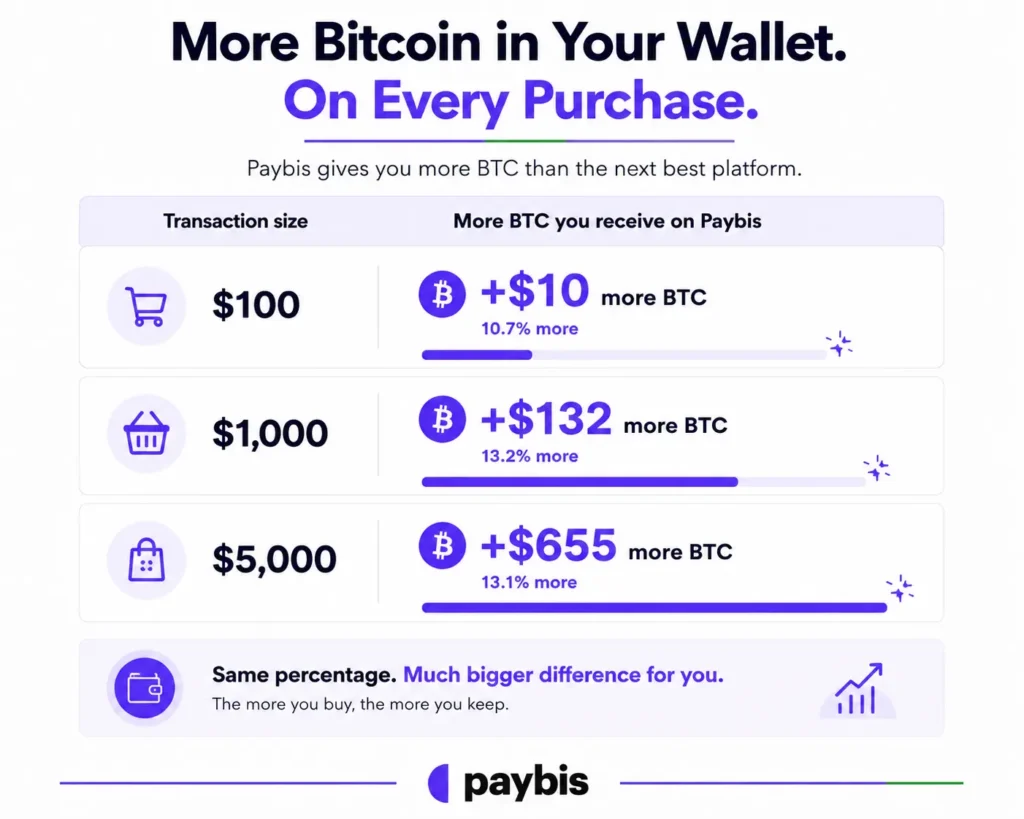
The percentage is similar at $1,000 and $5,000. But 13% of $5,000 is not the same dollar amount as 13% of $1,000. The raw crypto difference at $5,000 is meaningful in a way that the same percentage at $100 is not.
This has a practical implication: the effort of comparing platforms before a purchase scales with transaction size. At $100, the difference between platforms is real but small. At $1,000 and above, spending a few minutes on a Net Received comparison is consistently worth the time.
The $5,000 USDC example makes the same point from a different angle. On a $5,000 USDC purchase on Paybis, a SEPA bank transfer returned 4,894 USDC. The same $5,000 purchase by card returned 4,755 USDC. The 139 USDC difference comes entirely from the payment method, on the same platform, for the same asset, on the same day.
What are the three things the data made clear?
Fee transparency is an industry-wide problem. Payment method matters far more than most users know. The headline fee percentage is not the full cost of a transaction.
Starting with transparency: almost none of the 22 platforms reviewed showed a full cost breakdown before the checkout stage. This is not a technical limitation. It is a design choice. Showing the full cost earlier gives users the information they need to go elsewhere. Most platforms do not show it earlier.
The usability study confirms how this lands. Users described feeling confused, unable to compare platforms fairly, and uncertain about what they had agreed to pay. The confusion is not a user failing. It is the predictable result of an industry where the information needed to compare is usually withheld until after the decision point.
On payment method: the data shows gaps of 100 USDC or more on a single $5,000 transaction, depending purely on whether the user paid by card or by bank transfer. Most users in the study did not know the payment method changed the amount of crypto received. They thought the fee was fixed and the method was a matter of convenience.
On headline fees: a platform advertising 1% can deliver less crypto than one advertising 2%, if the spread inside the exchange rate is wider. The named fee and the total cost are two different things, and the platforms with the lowest advertised fees are not always the cheapest. Net received is the only number that captures the spread, the processing cost, and the platform fee together.
What did Paybis change as a result?
We tested five different fee display formats with real users, compared net received across 22 competitors, and reviewed how each platform discloses its costs. Based on all of that, we redesigned the Paybis fee display to show the full breakdown in exact currency amounts at the quote stage, before the user confirms anything.
The quote screen on Paybis now shows two lines: the service fee (which covers platform operations, the payment processing cost, and the spread) and the network fee (passed straight from the blockchain, with Paybis taking no cut). Both are shown in dollars. Net received is shown below.
The rate is locked for 15 minutes once the quote is generated. The number you see before you confirm is the number that executes.
The 0% Paybis fee on first card purchases per asset came out of the same exercise. If the quote experience is built around showing costs clearly, the way to demonstrate that is to remove the Paybis fee from the first transaction and let users see how the quote works without paying for the privilege.
Bottom Line
The research set out to answer a simple question: what does it actually cost to buy and sell crypto?
The answer is that the cost depends heavily on choices most users do not know they are making, and on information most platforms do not share before the decision point. The payment method changes the cost. The transaction size changes the gap between platforms. The spread inside the rate changes the outcome without appearing on any fee line.
Almost none of the 22 platforms reviewed gave users the information they needed before checkout. The one that did is the one that built this study.
Fees in crypto are not complicated. The way most platforms present them is.
About Paybis
Paybis is a regulated cryptocurrency exchange operating in 180+ countries, supporting 90+ cryptocurrencies and 20+ payment methods. FCA-regulated and MiCA-compliant, Paybis ran a fee transparency study across 22 platforms in 2026 and publishes the full cost breakdown at the quote stage, in exact amounts, before you confirm. The first time you buy each crypto with a card, Paybis takes nothing on top.
FAQ
How did Paybis select which platforms to compare?
The comparison covered 22 platforms across a range of sizes and geographies. Platforms were selected to represent the range of options a typical retail crypto buyer would encounter, not to produce a favourable result.
Are the win rates a guarantee that Paybis is always cheaper?
The win rates reflect a single point-in-time snapshot across the platforms and payment methods tested. Crypto rates, spreads, and platform pricing change continuously with market conditions. The figures show what the data found at that moment. They are not a guarantee of future performance on any specific transaction.
Why is net received a better metric than advertised fee percentage?
Because advertised fee percentages capture only one component of the total cost. The spread inside the exchange rate, the payment processing cost, and the network fee all affect how much crypto lands in your wallet, and none of them are consistently named in an advertised percentage. Net received captures all four costs at once, which is why it is the only number that allows accurate platform comparisons.
What was the sample in the usability study?
The usability study tested different fee display formats with real users and recorded both their choices and their reasoning. The figures cited (84.9%, 88.9%, 64.3%) reflect the distribution of preferences across the sample. The study was designed to understand what information people want before confirming a crypto purchase, not to validate a pre-existing design.
Why do some payment methods have much lower win rates than others?
Because payment methods carry different processing costs, and those costs feed directly into the service fee and the net crypto received. Card payments cost 4.5-6.5% to process through the card network. Bank transfers cost a fraction of that. The win rate reflects how often Paybis returned more crypto than competitors for that payment method, which is partly a function of how efficiently the platform prices the processing cost.
Disclaimer: Don’t invest unless you’re prepared to lose all the money you invest. This is a high‑risk investment and you should not expect to be protected if something goes wrong. Take 2 mins to learn more at: https://go.payb.is/FCA-Info