EMA (Exponential Moving Average)
The EMA (Exponential Moving Average) is basically a weighted moving average that considers the latest price data more than its predecessor, making it more responsive to new information and trends as opposed to the SMA (Simple Moving Average).
Table of contents
What does EMA Mean?
The exponential moving average (EMA) is one of the most used technical analysis tools by traders and investors in analyzing price trends. Unlike simple moving averages that assign equal weights to all chosen period data points, EMA gives more weight to recent prices. It helps in identifying short-term trends and possible buy or sell signals in financial markets.
How Does EMA Work?
EMA smoothed out price data to produce a trend-following indicator that is not much affected by random price fluctuations. It goes like this:
- Calculation basis: The computation of EMA starts with the current valuation and then successively looks into historical valuations. There is a higher influence from the latest prices on EMA as opposed to older ones which fade away.
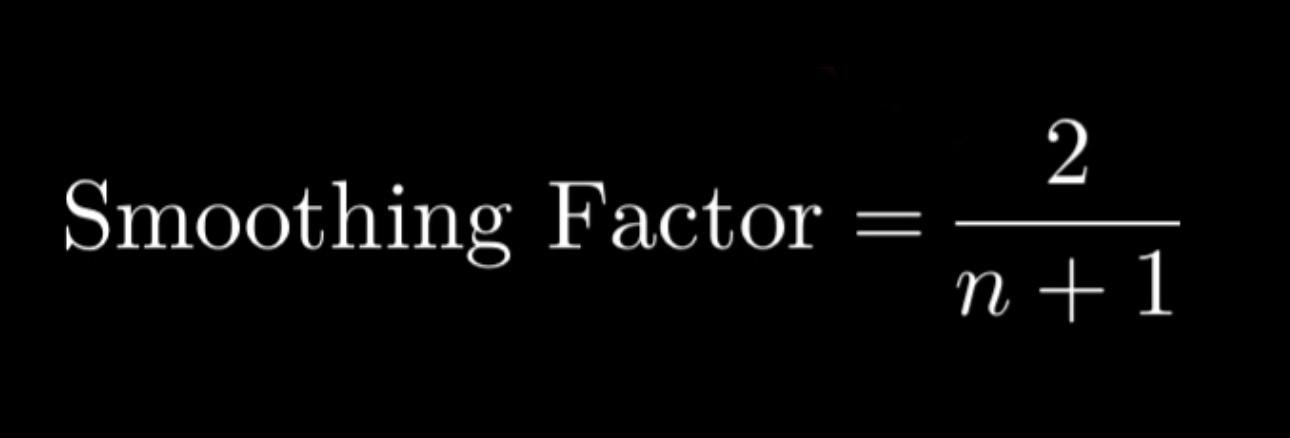
- Smoothing factor: The smoothing factor (or multiplier) decides the weight of the most recent price. It is calculated based on the selected time period (n). The formula for computing the smoothing factor will be:
- EMA calculation: The EMA for a given day is calculated using the following formula:
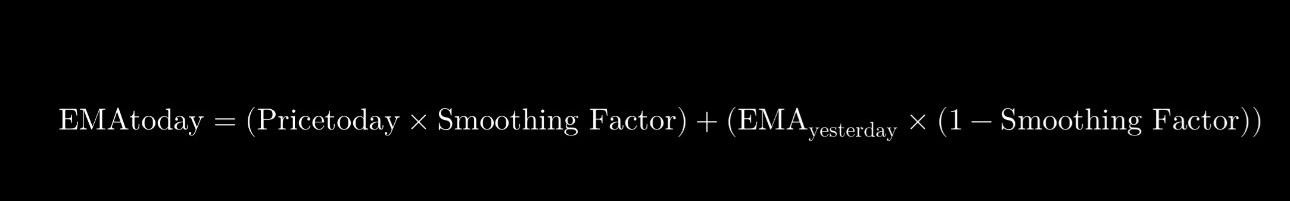
In this calculation, the price of the day is combined with an EMA value on the previous day in order to make sure that as new price data comes in, EMA keeps adjusting.
- Start point: The first data point (initial EMA value) for calculating EMA is usually the Simple Moving Average (SMA) of the first period.
Traders who understand these steps can observe how a security’s price line becomes smoother, which better captures its underlying trend.
EMA Benefits
This has led to wide adoption of EMA among traders and analysts due to some advantages it has:
- Responsiveness: This makes it efficient at spotting short-term trends and reversals since it reacts quickly when prices change recently.
- Smoothing effect: The use of more recent prices by the EMA helps flatten out price fluctuations such as those caused by short-term volatility or noise.
- Trend identification: Identifying trends, confirming them, and showing potential entry and exit points for trades, helps traders use EMA.
- Compatibility: This indicator can be used along with other technical indicators or chart patterns, making trading strategies and decision-making more effective.
These are reasons why many traders prefer using EMA for carrying out technical analysis.
How to Use EMA in Trading?
The Exponential Moving Average (EMA) is a versatile tool that can be used in various ways to inform trading decisions:
- Trending: The direction of a trend is identified by traders through the use of the EMA. If the price is situated above the EMA, an uptrend prevails. When it is below, it demonstrates a downtrend.
- Support and resistance levels: Dynamic support or resistance levels are offered by the EMA. These levels are often responsible for prices rebounding from such points, which can provide potential entry/exit points.
- Crossovers: Trading signals are commonly found on EMA crossovers. A bullish crossover occurs when a shorter period EMA crosses above a longer period EMA suggesting a potential buy signal while a bearish crossover happens when a shorter period EMA crosses below a longer period, indicating a possible sell signal.
- Divergence: Divergences between the market value and the EMA can indicate a likely reversal. In case prices are going up while the moving average goes down, there may be an impending downturn.
By using these techniques, traders can improve their decision-making process and fine-tune their trading strategies.
Conclusion
For this reason, technical analysis uses exponential moving averages (EMAs) because they are responsive to price changes and help to detect trends quickly.
By knowing how it is calculated, what it is used for, and its advantages for traders they get the best out of this useful tool in improving their strategies and market studies.
EMA is a key element in technical trading, whether used in isolation or conjunction with other indicators.
FAQ
What is the Exponential Moving Average (EMA)?
EMA refers to an upward trend line that has been plotted on a chart trading system, whereby it includes some recent prices as compared to the Simple Moving Average (SMA). It gets updated more frequently than SMA since it considers new trends as well.
What are some advantages of using EMA?
Advantages include: greater sensitivity to recent price movements, smoothing out price data, identifying trends, and compatibility with other technical indicators.
How can traders use EMA in their strategies?
Some uses for it could be finding trends, establishing support and resistance levels, analyzing buy/sell signals through crossovers, and recognizing divergences that might result in reversals.
Disclaimer: Don’t invest unless you’re prepared to lose all the money you invest. This is a high‑risk investment and you should not expect to be protected if something goes wrong. Take 2 mins to learn more at: https://go.payb.is/FCA-Info